Understanding Graphs and Tables (Grade 12 NSC Matric Geography): Revision Notes
Understanding Tables
Understanding how to read and interpret tables is an essential skill in geography. Tables present data in an organised way that makes it easy to compare information and identify patterns. This section will teach you a systematic approach to reading any geographical table effectively.
Tables are one of the most common ways geographical information is presented in textbooks, exams, and research. Mastering table interpretation will significantly improve your ability to analyse geographical data and support your answers with specific evidence.
What is a table?
A table is a structured way of presenting information using rows and columns. In geography, tables often show statistical data about countries, regions, economic activities, or natural resources. The information is arranged so you can easily compare different places, time periods, or categories.
Steps to read a table
When you encounter any table in your geography studies, follow these four systematic steps to extract all the important information:
The Four-Step Method for Reading Tables
Following these steps in order ensures you don't miss crucial information and can interpret the data accurately. Never skip straight to the numbers without understanding the context!
Step 1: Examine the heading
Start by reading the table heading carefully. The heading tells you exactly what information the table contains. It sets the context for all the data you're about to analyse. For example, a heading might tell you whether the table shows population data, economic statistics, or environmental measurements.
Step 2: Study the column labels
Next, look at the labels in each column. These labels tell you what type of information is presented in each column. Understanding what each column represents is crucial for making sense of the numbers or text in the table.
Step 3: Identify relationships between data
Look for patterns and relationships between the different columns of information. Ask yourself how the data in one column relates to the data in another column. This step helps you understand what the table is trying to show you about the topic.
Step 4: Apply your understanding
Now you're ready to answer questions about the table or draw conclusions from the data. With a clear understanding of what the table shows and how the information relates, you can interpret the data accurately.
Practical example: South Africa's mineral production
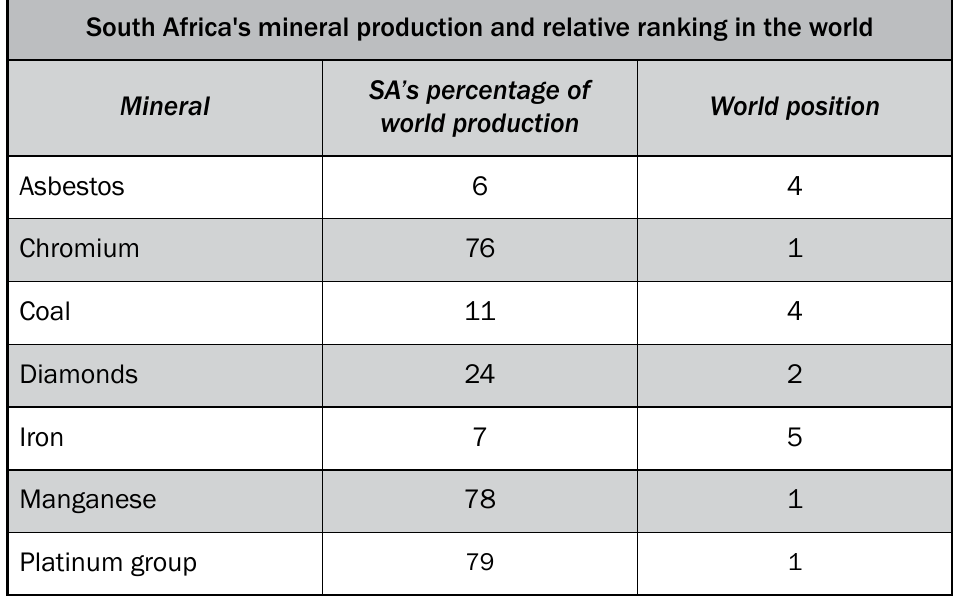
Let's apply these steps to a real geographical table about South Africa's mineral production and world ranking.
Worked Example: Analysing a Mineral Production Table
We'll use the systematic four-step approach to interpret data about South Africa's mineral production and global ranking.
Step 1 - The heading: The table heading tells us this data shows "South Africa's mineral production and relative ranking in the world." This immediately tells us we're looking at mining data and how South Africa compares globally.
Step 2 - Column labels: The table has three columns:
- Mineral: Lists the different minerals South Africa produces
- SA's percentage of world production: Shows what portion of global production comes from South Africa
- World position: Shows South Africa's ranking among all countries for each mineral
Step 3 - Understanding relationships: By comparing the columns, we can see important patterns:
- Higher percentages of world production generally correspond to better world rankings
- South Africa dominates in certain minerals like chromium (76% of world production, ranked 1st)
- Some minerals show South Africa as a major but not dominant producer, like diamonds (24% production, ranked 2nd)
Step 4 - Drawing conclusions: From this table, we can conclude that South Africa is a major global mining nation, particularly strong in minerals like chromium, manganese, and platinum group metals where it holds the number 1 world position.
Applying step 1: The heading
The table heading tells us this data shows "South Africa's mineral production and relative ranking in the world." This immediately tells us we're looking at mining data and how South Africa compares globally.
Applying step 2: Column labels
The table has three columns:
- Mineral: Lists the different minerals South Africa produces
- SA's percentage of world production: Shows what portion of global production comes from South Africa
- World position: Shows South Africa's ranking among all countries for each mineral
Applying step 3: Understanding relationships
By comparing the columns, we can see important patterns:
- Higher percentages of world production generally correspond to better world rankings
- South Africa dominates in certain minerals like chromium (76% of world production, ranked 1st)
- Some minerals show South Africa as a major but not dominant producer, like diamonds (24% production, ranked 2nd)
Applying step 4: Drawing conclusions
From this table, we can conclude that South Africa is a major global mining nation, particularly strong in minerals like chromium, manganese, and platinum group metals where it holds the number 1 world position.
Key points when analysing tables
When working with geographical tables, always remember to:
Essential Table Analysis Techniques
- Read all headings and labels before looking at the numbers
- Look for the highest and lowest values to identify extremes
- Compare related data to spot trends and patterns
- Consider what the data tells you about real-world geography
- Think about the causes and effects of the patterns you observe
Common table types in geography
You'll encounter various types of tables in your geography studies:
- Economic data tables: Showing production, trade, or employment statistics
- Population tables: Displaying demographic information
- Climate tables: Presenting temperature and rainfall data
- Development indicators: Comparing countries' social and economic development
Each type requires the same systematic approach, but you'll need to understand the specific geographical concepts relevant to each topic.
Each table type requires familiarity with specific geographical terminology and concepts. For example, climate tables might include terms like "precipitation" and "diurnal range," while economic tables might reference "GDP per capita" or "trade balance."
Exam tips for table questions
Critical Exam Strategies for Table Questions
When answering exam questions about tables:
- Always refer to specific data from the table in your answers
- Quote exact figures when asked for evidence
- Explain patterns rather than just describing individual numbers
- Link your table analysis to broader geographical concepts
- Make sure you understand what each column represents before attempting to answer
Common Mistake to Avoid: Never provide vague answers like "the numbers are high" - always use specific data from the table to support your points.
Remember!
Key Points to Remember:
- Always follow the four systematic steps: heading, labels, relationships, questions
- Tables are tools for comparison - look for patterns and differences in the data
- Understanding what each column represents is essential before analysing the numbers
- South Africa's mineral wealth makes it a major player in global mining, particularly for chromium, manganese, and platinum
- Practice reading different types of geographical tables to build your confidence with data interpretation