Touching the Axes (Grade 12 NSC Matric Mathematical Literacy): Revision Notes
Touching the Axes
Understanding what happens when a graph touches or crosses the axes is essential for interpreting real-world mathematical situations. This concept helps you read graphs more effectively and understand the relationship between variables.
What does it mean to touch the axes?
When we say a graph "touches" an axis, we are describing where the line meets or crosses one of the coordinate axes. This has specific mathematical meaning and is crucial for graph interpretation.
Touching the vertical axis (y-axis)
When a graph touches the vertical axis, it means that the quantity on the horizontal axis has reached 0. At this point, you can read the y-intercept from the graph.
Touching the horizontal axis (x-axis)
When a graph touches the horizontal axis, it means that the quantity on the vertical axis has reached 0. At this point, you can read the x-intercept from the graph.
Worked example: Water bottle emptying
Let's examine a practical situation to understand how graphs touch the axes in real-world contexts.
Worked Example: Water Bottle Emptying
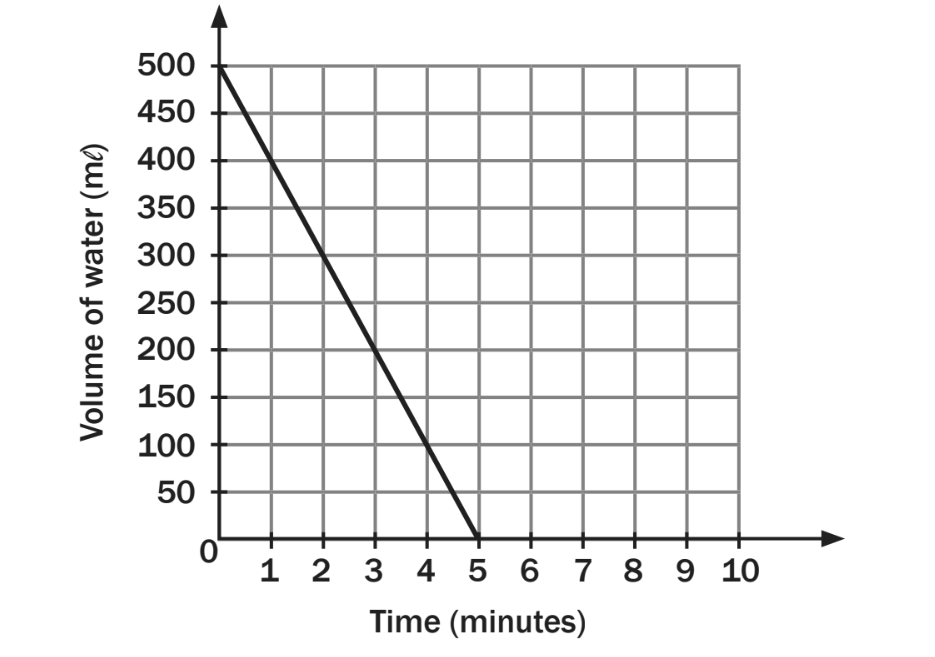
Scenario: Tumelo empties his 500 mℓ water bottle at a constant rate.
Interpreting the graph:
Looking at this graph, we can observe several important features:
- Starting point: The line begins at the top left, showing 500 mℓ at time 0
- Direction: The line slopes downward from left to right, indicating the water volume decreases over time
- End point: The line reaches the horizontal axis (time axis) when the volume becomes 0
Step-by-step solution:
Part a) As time elapses, the volume of water decreases from 500 mℓ until the bottle is empty at the end of the 5th minute.
Part b) We can identify two key points where the graph touches the axes:
- When t = 0 (touching the vertical axis): v = 500 mℓ
- When t = 5 (touching the horizontal axis): v = 0 mℓ
Understanding the relationship
This example demonstrates how touching the axes reveals important information:
The intercepts provide crucial starting and ending information:
- Vertical axis intercept (y-intercept): Shows the initial volume (500 mℓ)
- Horizontal axis intercept (x-intercept): Shows when the bottle becomes empty (5 minutes)
The constant rate of decrease creates a straight line that connects these two intercept points.
Exam tips
Essential Exam Strategies:
- Always identify where graphs touch or cross the axes
- Read the scale carefully to determine exact values at intercepts
- Remember that intercepts often represent starting conditions or end results
- Use intercepts to write equations or make predictions
Key Points to Remember:
- When a graph touches the vertical axis, the horizontal variable equals zero
- When a graph touches the horizontal axis, the vertical variable equals zero
- Intercepts provide crucial information about starting points and end points in real-world situations
- Linear graphs with constant rates create straight lines between intercept points
- Always check both axes to fully understand the relationship between variables