Tools and Techniques (Grade 12 NSC Matric Mathematics): Revision Notes
Tools and Techniques
Introduction
When solving probability problems, there are three main tools that help organise information and calculate probabilities accurately. These are Venn diagrams, tree diagrams, and two-way contingency tables. Each tool is particularly useful for different types of probability problems.
Choosing the Right Tool:
- Venn diagrams work best for problems involving multiple events and their intersections or unions
- Tree diagrams are ideal for sequential events where outcomes depend on previous results
- Two-way contingency tables help organise data and test relationships between categorical variables
Venn diagrams
Definition and purpose
Venn diagrams are visual representations that show relationships between different events or sets. They use overlapping shapes (usually circles or rectangles) to illustrate how events intersect, combine, or remain separate within a sample space.
Key features
The key components of Venn diagrams include several important elements that help visualise probability relationships:
- Each event is represented by a shape (circle or rectangle)
- The sample space is shown as the outer boundary containing all possible outcomes
- Intersections show where events overlap (outcomes that belong to multiple events)
- Unions represent all outcomes that belong to at least one event
- The region outside all events but within the sample space represents outcomes that don't belong to any of the events
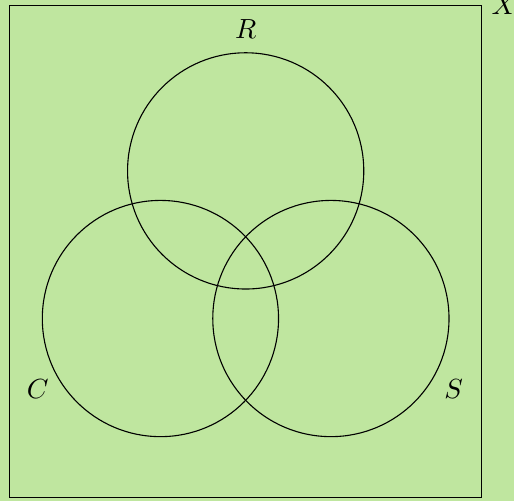
The basic structure shows three events R, C, and S with their various intersection regions.
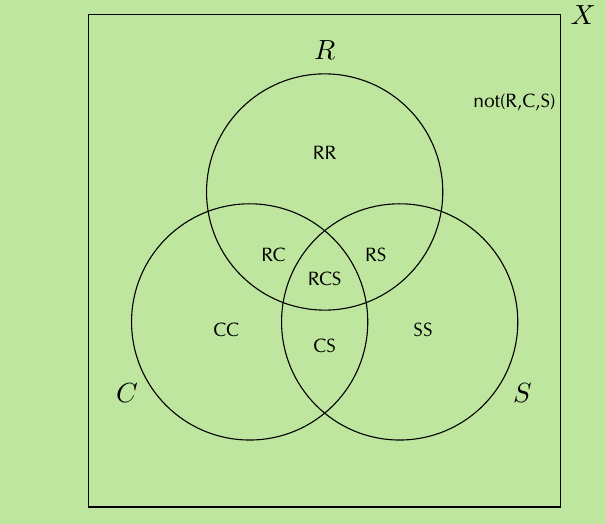
This diagram shows the proper notation for different regions within a three-set Venn diagram.
Critical Construction Rule: Always work from the centre intersection outward to avoid calculation errors. Start with the region where all sets overlap, then move to two-way intersections, then individual sets only.
How to construct a Venn diagram
- Identify the sample space and all relevant events
- Draw the basic structure with appropriately labelled shapes
- Calculate values for each region systematically, typically starting from the centre intersection and working outward
- Fill in the values for each distinct region
- Check your work by ensuring all values sum to the total sample space
Worked Example: Sports participation
A school has 200 Grade 12 boys. Their sports participation is:
- 107 play rugby
- 90 play soccer
- 63 play cricket
- 35 play rugby and soccer
- 23 play rugby and cricket
- 15 play rugby, soccer and cricket
- 190 boys play at least one sport
Step 1: Calculate boys playing none of the sports
Boys playing none = 200 - 190 = 10
Step 2: Set up the Venn diagram structure
Let R = rugby, S = soccer, C = cricket, X = sample space
Step 3: Calculate each region systematically
- Centre (all three sports): RCS = 15
- Rugby and soccer only: RS = 35 - 15 = 20
- Rugby and cricket only: RC = 23 - 15 = 8
- Soccer and cricket only: CS = x - 15 (where x needs to be found)
- Rugby only: RR = 107 - 20 - 8 - 15 = 64
- Soccer only: SS = 90 - 20 - (x - 15) - 15 = 70 - x
- Cricket only: CC = 63 - 8 - (x - 15) - 15 = 55 - x
Step 4: Use the total to find the unknown value
64 + 8 + 15 + 20 + (x - 15) + (70 - x) + (55 - x) = 190
217 - x = 190
Therefore x = 27
Step 5: Calculate the final answer
Boys playing soccer and cricket but not rugby: CS = 27 - 15 = 12
The probability that a randomly chosen boy plays at least two sports:
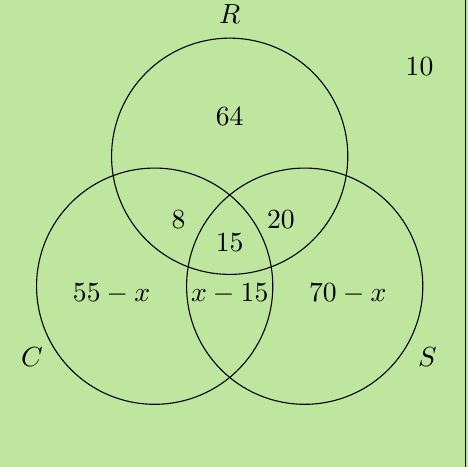
This shows how algebraic expressions are used within the diagram before solving for the unknown value.
Tree diagrams
Definition and purpose
Tree diagrams are visual tools that show all possible outcomes of a sequence of events. They display the probability of each outcome at each stage and help calculate the overall probability of complex sequences.
Key features
Tree diagrams have several distinctive characteristics that make them powerful probability tools:
- Each branch represents a possible outcome at that stage
- Probabilities are written along each branch
- The sum of probabilities at each level must equal 1
- Final outcomes are calculated by multiplying probabilities along the path from start to finish
The Multiplication Principle: To find the probability of any complete sequence, multiply the probabilities along each branch from start to finish. This is the fundamental rule that makes tree diagrams so effective for sequential events.
How to construct a tree diagram
- Identify all possible outcomes at each stage of the sequence
- Draw the first level showing initial outcomes and their probabilities
- Add subsequent levels for each additional stage
- Label all branches with appropriate outcomes and probabilities
- Calculate final probabilities by multiplying along each complete path
Branch Probability Check: At each node, the probabilities of all branches leaving that node must sum to exactly 1. This is a crucial check to ensure your diagram is constructed correctly.
Worked Example: Supermarket floor conditions
A supermarket floor has different wetness conditions affecting the probability of people falling:
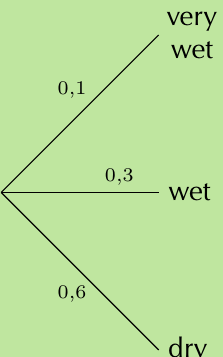
- Probability of very wet floor: 0.1
- Probability of wet floor: 0.3
- Probability of dry floor: 0.6
- If very wet, probability of falling: 0.6
- If wet, probability of falling: 0.36
- If dry, probability of falling: 0.12
Step 1: Draw the first level showing floor conditions
Step 2: Add the second level showing fall/no fall outcomes
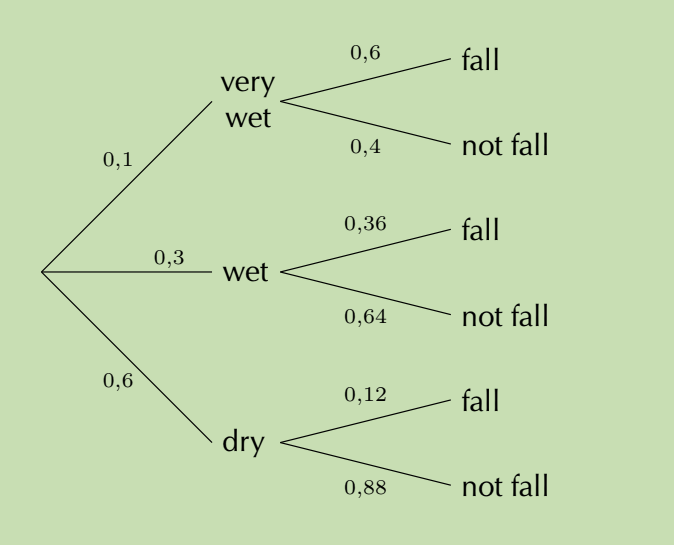
Step 3: Calculate final outcome probabilities
- P(very wet and fall) = 0.1 × 0.6 = 0.06
- P(very wet and not fall) = 0.1 × 0.4 = 0.04
- P(wet and fall) = 0.3 × 0.36 = 0.108
- P(wet and not fall) = 0.3 × 0.64 = 0.192
- P(dry and fall) = 0.6 × 0.12 = 0.072
- P(dry and not fall) = 0.6 × 0.88 = 0.528
Step 4: Answer specific questions
- P(fall) = 0.06 + 0.108 + 0.072 = 0.24 or 24%
- P(not fall) = 0.04 + 0.192 + 0.528 = 0.76 or 76%
Step 5: Test for independence To check if floor being dry and falling are independent events: P(dry and fall) should equal P(dry) × P(fall) 0.072 ≠ 0.6 × 0.24 = 0.144 Since these are not equal, the events are dependent.
Two-way contingency tables
Definition and purpose
Two-way contingency tables are data organisation tools that display the relationship between two categorical variables. They show counts or percentages in a grid format and are particularly useful for determining whether events are independent.
Key features
These tables provide a structured approach to analysing relationships between variables:
- Variables are arranged in rows and columns
- Entries show frequencies or probabilities for each combination
- Marginal totals appear at the edges
- Useful for calculating conditional probabilities
- Help identify patterns and relationships between variables
Two-way contingency tables are especially powerful when you need to test for independence between two categorical variables or calculate conditional probabilities based on given conditions.
Worked Example: Two-Way Contingency Table
Context: A class of 40 students was asked whether they prefer Tea or Coffee. The results were recorded by Gender.
Step 1: Record the counts
| Tea | Coffee | Row Total | |
|---|---|---|---|
| Female | 12 | 8 | 20 |
| Male | 10 | 10 | 20 |
| Column Total | 22 | 18 | 40 |
Check: totals add to 40
Step 2: Convert to row percentages (each row sums to 100%)
| Tea | Coffee | |
|---|---|---|
| Female | 60% | 40% |
| Male | 50% | 50% |
Interpretation: Among females, 60% prefer tea; among males, preferences are split 50–50.
Step 3: Common probabilities
- Conditional:
- Conditional:
Step 4: Quick comments
- Tea is slightly more popular overall (55%).
- Preference appears mildly related to gender: females lean more towards tea (60%) than males (50%).
Key formulas and rules
Understanding the mathematical relationships is crucial for applying these tools effectively.
Essential Formulas:
For Venn diagrams:
- Union:
- Complement:
- Intersection: Found by systematic calculation of overlapping regions
For tree diagrams:
- Multiplication rule:
- Total probability: Add all relevant end probabilities
- Branch check: Probabilities from each node must sum to 1
For independence testing:
- Events A and B are independent if:
- If this equation doesn't hold, the events are dependent
Critical Independence Test: The formula is the definitive test for independence. If the left and right sides are equal, events are independent; if not, they are dependent. This test works with all three tools.
Exam tips
Essential Exam Strategies:
- Venn diagrams: Always work from the centre intersection outwards to avoid errors
- Tree diagrams: Check that probabilities at each level sum to 1 as you construct the diagram
- Both tools: Clearly label all regions and branches before starting calculations
- Show working: Examiners award marks for method, so show each step clearly
- Check answers: Final probabilities should be between 0 and 1, and related probabilities should be consistent
Key Points to Remember:
-
Venn diagrams are perfect for problems involving multiple events and their combinations - work systematically from centre outward
-
Tree diagrams excel at sequential events where outcomes depend on previous results - multiply probabilities along each path
-
Two-way contingency tables help organise data and test for independence between categorical variables
-
Always check that your probabilities are logical - branch probabilities sum to 1, final probabilities are between 0 and 1
-
Use the appropriate tool for each problem type - this choice often determines how easily you can solve the problem