Selection Pressures in an Ecosystem (HSC SSCE Biology): Revision Notes
Selection Pressures in an Ecosystem
What are selection pressures?
Selection pressures are environmental factors that determine which organisms survive and reproduce successfully. When the environment changes, certain resources become limited, forcing individuals to compete. This competition drives natural selection.
Here's how it works:
- Environmental changes create selection pressures
- Organisms with beneficial variations are more likely to survive
- These variations (if genetic) pass to offspring
- Over generations, the population becomes adapted to the environment
- Biodiversity within populations is essential for survival
Critical Concept: Without existing variation in a population, few or no individuals would survive when selection pressures occur. This is why maintaining biodiversity is essential for the long-term survival of any species.
Distribution and abundance of species
Two important concepts help us understand where and how many organisms exist in an ecosystem:
Distribution: Where a species is found geographically within an ecosystem
Abundance: How many individuals of that species live throughout the ecosystem
Selection pressures (both abiotic and biotic) affect distribution and abundance by:
- Causing fluctuations in population numbers
- Influencing movement patterns
- Determining which areas populations can occupy based on available resources
Distribution and abundance are interconnected - understanding both gives us a complete picture of a species' success in an ecosystem. For example, a species might have wide distribution but low abundance, or be highly abundant in a restricted distribution.
Types of selection pressures
Abiotic selection pressures
Abiotic factors are non-living environmental conditions. Different environments have different key abiotic pressures:
Terrestrial environments: The main abiotic factors affecting species distribution and abundance are:
- Temperature range
- Light availability
- Water availability
Example: Rainfall as a Selection Pressure
Saltbushes (Atriplex) grow in desert environments with very low rainfall, while ferns grow in tropical rainforests with high rainfall. Rainfall acts as an abiotic selection pressure determining which species can survive. Species that cannot tolerate the water availability in an area simply cannot establish populations there.
Aquatic environments: Different factors matter in freshwater versus marine environments:
| Freshwater environment | Marine (saltwater) environment |
|---|---|
| Temperature variation | Salinity |
| Dissolved gases (O₂ and CO₂) | Dissolved gases (O₂ and CO₂) |
| pH (acidity) of water | Tidal movements and wave action |
| Light availability | |
| Clarity of water |
Biotic selection pressures
Biotic factors are living components that influence an organism's existence. Although biotic factors vary greatly between ecosystems, key selection pressures include:
- Availability and abundance of food - determines if organisms can obtain sufficient energy
- Number of competitors - affects access to resources
- Number of mates - influences reproductive success
- Number of predators - impacts survival rates
- Number and variety of disease-causing organisms - affects population health
Example: Food Availability
The availability of worms as a food source for kookaburras may be much higher in one ecosystem than another, affecting kookaburra abundance in each location. This demonstrates how a single biotic factor can have significant impacts on population distribution and abundance.
Measuring plant abundance
Since plants remain in one place, calculating their abundance is relatively straightforward. However, counting every plant in a large area is impractical, so ecologists use sampling techniques to estimate abundance.
The quadrat sampling method
A quadrat is a 1 m × 1 m square frame used to sample representative areas of an ecosystem. This method works well for plants and slow-moving animals.
How it works:
- Randomly place multiple quadrats (typically 10) throughout the study area
- Estimate the percentage cover for each quadrat (what proportion is covered by the species)
- Calculate the average percentage cover from all quadrats
- If the total area is known, convert percentage to actual area
Percentage cover calculation example
Let's say we want to estimate grass cover on a school oval:
Ten 1 m × 1 m quadrats are randomly placed and percentage cover estimated for each:
| Quadrat | 1 | 2 | 3 | 4 | 5 | 6 | 7 | 8 | 9 | 10 | Total |
|---|---|---|---|---|---|---|---|---|---|---|---|
| Estimated percentage cover | 50 | 90 | 40 | 60 | 20 | 70 | 90 | 80 | 10 | 30 | 540 |
Calculation:
- Total of 10 quadrats = 540%
- Average % = 540 ÷ 10 = 54%
If the total area is 250 m², then:
- Estimated grass cover area = 54% × 250 m² = 135 m²
- Bare area requiring new turf = 250 m² - 135 m² = 115 m²
Formula for estimating abundance
When counting individual plants (rather than using percentage cover):
Worked Example: Calculating Plant Abundance
If 42 individuals have been counted in ten 1 m × 1 m quadrats, what is the estimated abundance in an area of 200 m²?
Step 1: Identify the values
- Total counted = 42 individuals
- Quadrat area = 1 m²
- Number of quadrats = 10
- Total area = 200 m²
Step 2: Apply the formula
Step 3: Calculate
Answer: 840 individuals in the 200 m² area
Advantages and Limitations of Quadrat Sampling
Advantages:
- Easy and inexpensive
- Minimal disturbance to the environment
- Can also determine distribution along transects
Disadvantages:
- Only suitable for plants and slow-moving animals
- Accuracy depends on number of samples taken - more quadrats give more reliable estimates
Measuring animal abundance
Calculating animal abundance is more challenging because animals move around and may hide. The mark-release-recapture technique provides estimates for mobile animal populations.
The mark-release-recapture technique
This method involves three stages:
1. Capture: A random sample of animals is captured using appropriate methods (nets, traps, etc.)
2. Mark and release: Captured animals are marked or tagged (e.g., leg bands, ear tags) then released back into their habitat. They're given time to mix with the unmarked population.
3. Recapture: After a suitable period, a second sample is captured. The number of marked individuals in this second sample is counted.
Formula for mark-release-recapture
Where:
- = total population size (what we're estimating)
- = number marked in first sample
- = total number of animals recaptured (second sample)
- = number of marked animals in the recapture
Worked Example: Mark-Release-Recapture Calculation
In the first sample, 20 individuals were marked. In the second sample, 50 individuals were recaptured and of these, 10 were marked. What is the total population?
Step 1: Identify the values
- = 20 (marked in first sample)
- = 50 (total recaptured)
- = 10 (marked individuals in recapture)
Step 2: Apply the formula
Step 3: Calculate
Answer: The estimated total population is 100 individuals
Important assumptions
Critical Assumptions for Mark-Release-Recapture
The mark-release-recapture technique assumes:
- No population change between sampling periods (no migration, births, or deaths)
- Equal capture probability for all animals (no individuals are "trap happy" or "trap shy")
- Marked animals mix freely with the rest of the population and aren't hampered in their movement
Why this matters: If these assumptions aren't met, the population estimate will be less accurate. For example, if marked animals are easier to catch than unmarked ones, you'll overestimate the population size.
Comparison of sampling techniques
| Sampling technique | Equipment and method | Advantages | Disadvantages |
|---|---|---|---|
| Quadrat sampling | - Measuring tape, metre rulers or quadrats measure randomly placed 1 m × 1 m areas - Occurrence of organisms recorded and repeated - Individual species counted (small numbers) or percentage cover calculated (large numbers) | - Easy and inexpensive for large populations - Minimal environmental disturbance - Can determine distribution along transects | Only suited for plants and slow-moving animals |
| Mark-release-recapture | - Animals captured (traps, nets, pits) - Tagged or marked (e.g., limb bands) and released - After suitable mixing time, sample is recaptured - Number of tagged/marked animals counted - Numbers entered into formula - Technology sometimes used (GPS tracking, satellites) | Simple method providing estimates for animals in large populations that are difficult to count | - Only suitable for mobile animals - Can be time-consuming - Dependent on species, tagging method, and mixing time - Can disturb the environment |
When choosing a sampling technique, consider the organism type, its mobility, the ecosystem characteristics, and the resources available. The best method depends on your specific research question and practical constraints.
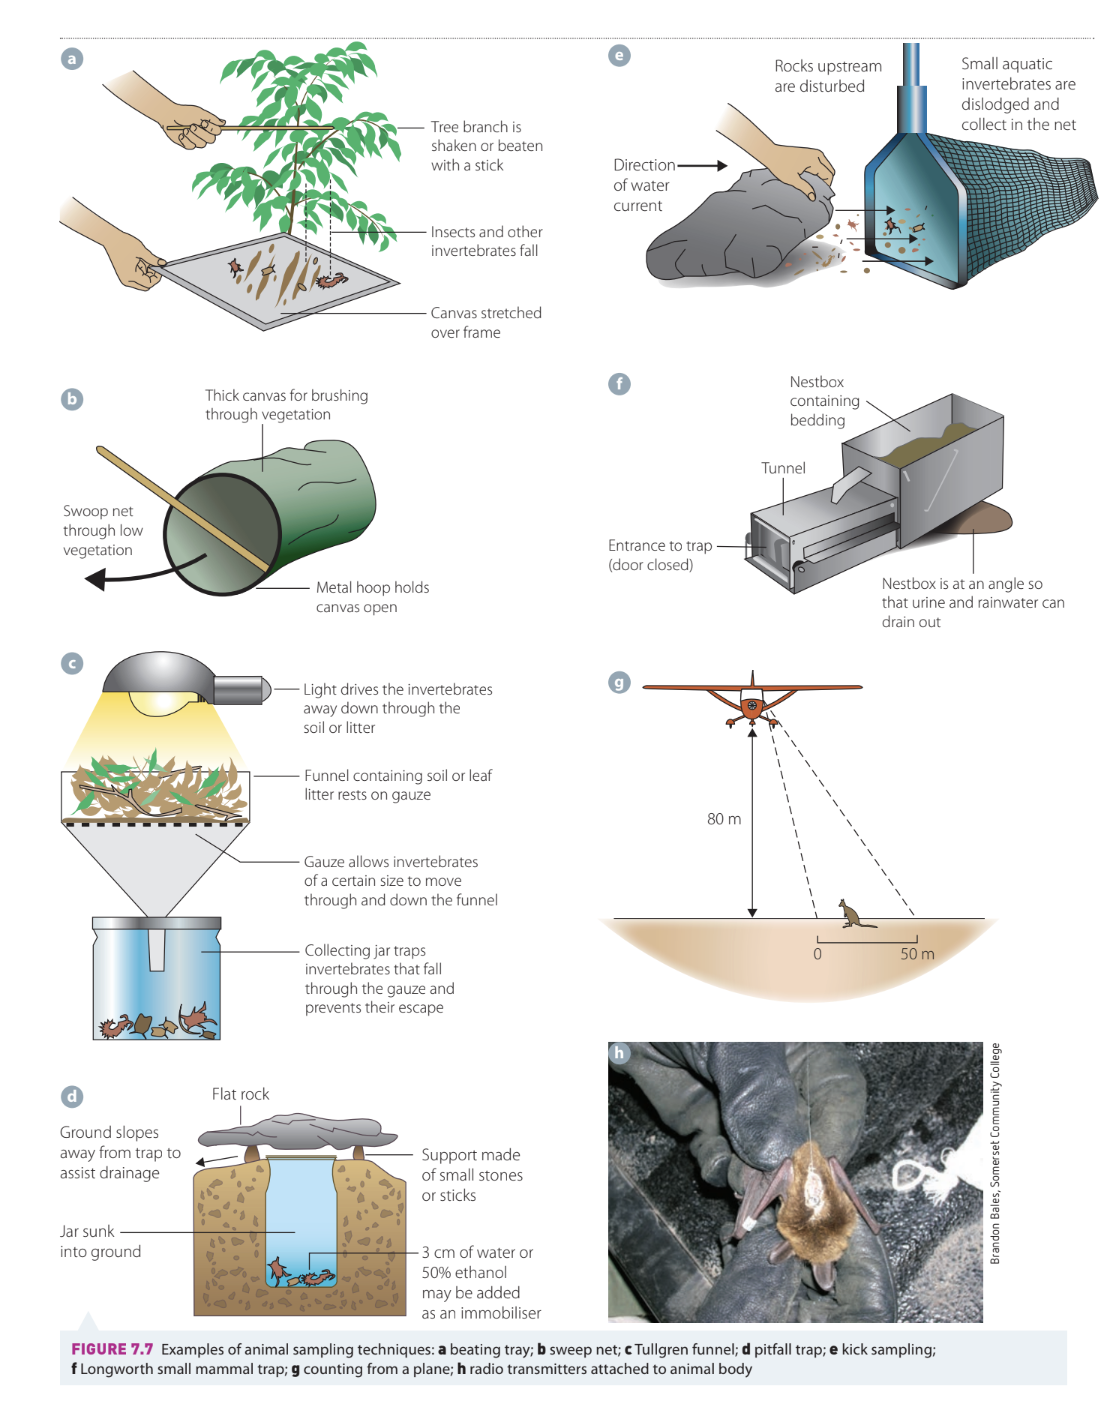
Other sampling and monitoring techniques
Traditional trapping techniques
Various methods capture animals safely for study:
-
Beating tray: Tree branches shaken to collect falling insects
-
Sweep net: Swooped through vegetation to catch invertebrates
-
Tullgren funnel: Light and heat drive organisms from soil/litter samples
-
Pitfall trap: Jar sunk in ground with water or ethanol to collect ground-dwelling animals
-
Kick sampling: Disturbing upstream rocks to collect aquatic invertebrates in downstream nets
-
Small mammal traps: Tunnel traps with nest boxes capture but don't harm mammals
-
Aerial surveys: Counting from aircraft following systematic patterns
-
Radio tracking: Transmitters attached to animals to monitor movements
UAV (unmanned aerial vehicle) or drone technology
Drones are becoming increasingly common for monitoring wildlife populations. They offer several advantages:
Benefits of UAV/Drone Technology
- Improved spatial and temporal resolution of data - can cover large areas quickly and repeatedly
- Computer technology can automatically identify and count species from images
- Access to areas inaccessible to humans on foot
- Better accuracy in population estimates
- Useful for managing invasive species
Important Concerns:
- May cause stress to animals, particularly nesting birds
- Requires training to minimise disturbance
- Still an emerging technology requiring further research on best practices
Population trends and transects
Examining population trends helps us understand what environmental conditions species are suited to. Transects are particularly useful for this purpose.
Transect: A narrow strip crossing the entire study area from one side to the other, providing an accurate way to represent the area simply.
Example 1: Mangrove species distribution
When studying a tidal estuary, a transect from sea to inland reveals how different mangrove species are distributed based on salinity tolerance:
- Species A: Highest abundance closest to the sea (tolerates high salinity)
- Species B: Most abundant in the middle zone (moderate salinity tolerance)
- Species C: Highest abundance inland (less tolerant of saline conditions)
Why Species Diversity Matters
This demonstrates the importance of species diversity - different mangrove species can populate the entire tidal estuary rather than just one part. If only one species existed, large portions of the estuary would be uncolonized, reducing the ecosystem's overall productivity and biodiversity.
Example 2: Eucalyptus species at different altitudes
In south-east New South Wales, different eucalyptus species dominate at different altitudes:
- Eucalyptus longifolia: Dominates lowest altitudes (0-300 m), peaking around 150 m with 15 individuals per 10 m²
- Eucalyptus radiata: Suited to most altitudes but peaks in middle range (400-800 m) with 35 individuals per 10 m²
- Eucalyptus pauciflora: Dominates higher altitudes (900-1500 m), peaking around 1200 m with over 40 individuals per 10 m²
Although species ranges overlap, each has a specific altitude where it's most abundant, showing adaptation to particular environmental conditions. Temperature, rainfall patterns, and soil conditions all change with altitude, creating different selection pressures at each elevation.
Example 3: Australian marsupial population response to food availability
A study of Antechinus stuartii (a small marsupial carnivore) examined population changes when food was supplemented:
Key observations:
- Control group (no extra food): Remained at low numbers (under 20 individuals)
- Food-supplemented groups: Increased to 25-28 individuals at peak
- When food was discontinued for one group: Numbers dropped dramatically but recovered quickly
What This Study Reveals About Biodiversity
Natural variation within the population allowed some individuals to survive on less food. This biodiversity enabled population recovery when food became available again.
Without this diversity, the population might not have survived the food shortage. This demonstrates why maintaining genetic variation is crucial for species survival - you never know which traits will be essential for surviving future environmental changes.
Practical applications
Understanding distribution and abundance allows ecologists to:
- Assess biodiversity before development and land clearing
- Develop management plans for conservation
- Identify threatened species and their habitats
- Understand corridors between ecosystems
- Predict how populations might respond to environmental changes
- Monitor the effectiveness of conservation efforts
Real-World Applications in Australia
- Pittwater Coastal Zone Flora and Fauna Study: Used for coastal management planning to balance development with conservation
- Blue Mountains National Park survey: Identified 211 native species (21 threatened), informing protection strategies
- Lower Hunter Valley studies: Identified essential corridors for drought-stressed animals, guiding land management decisions
These studies demonstrate how understanding population distribution and abundance directly informs conservation and land management policies.
Key Points to Remember
-
Selection pressures are environmental factors (abiotic and biotic) that determine which organisms survive and reproduce in an ecosystem
-
Natural selection is driven by selection pressures, favouring individuals with beneficial variations
-
Biodiversity within populations is essential for survival when selection pressures change
-
Distribution describes where species are found; abundance describes how many individuals exist
-
Quadrat sampling estimates plant abundance using percentage cover in randomly placed 1 m × 1 m squares
-
Mark-release-recapture estimates animal populations using the formula:
-
Transects help reveal distribution patterns and show which environmental conditions different species are adapted to
-
Understanding population trends allows predictions about species responses to environmental change