Energy Profiles (HSC SSCE Chemistry): Revision Notes
Energy Profiles
What are energy profiles?
An energy profile (also called a reaction profile) is a graph that displays how the energy of a chemical system changes as the reaction progresses from reactants to products. These diagrams are essential tools for understanding both the energy changes during reactions and the energy barriers that must be overcome.
Energy profiles combine two important concepts you've already encountered:
- Activation energy (Ea): The energy barrier that must be overcome for a reaction to proceed
- Enthalpy change (ΔH): The overall energy difference between reactants and products
Energy profiles are powerful visual tools that let you see at a glance whether a reaction releases or absorbs energy, and how difficult it is for the reaction to get started. Once you can read these diagrams fluently, you'll understand reactions at a much deeper level.
On an energy profile diagram:
- The horizontal axis represents the progress of reaction (from left to right, starting with reactants and ending with products)
- The vertical axis represents energy (increasing upwards)
- The curve shows how the system's energy changes throughout the reaction
Energy profiles for different reaction types
Energy profiles look different depending on whether the reaction is exothermic or endothermic. Understanding these differences is crucial for interpreting chemical reactions.
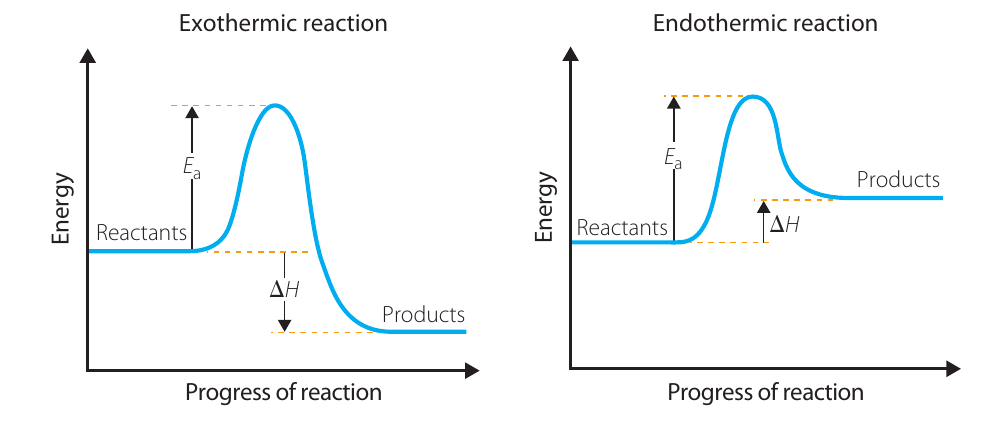
Exothermic reactions
In an exothermic reaction, energy is released to the surroundings. On an energy profile:
- The reactants start at a higher energy level
- The energy increases to reach the activation energy barrier (the peak)
- The products end at a lower energy level than the reactants
- The enthalpy change (ΔH) is negative because products have less energy than reactants
- The difference in height between reactants and products represents the energy released
Think of it like rolling a ball over a hill - the ball needs energy to get over the hill (activation energy), but once over, it settles at a lower level (products), releasing energy in the process.
Memory aid: "EXO means EXIT" - energy exits the system in exothermic reactions, so products are lower in energy.
Endothermic reactions
In an endothermic reaction, energy is absorbed from the surroundings. On an energy profile:
- The reactants start at a lower energy level
- The energy increases to reach the activation energy barrier (the peak)
- The products end at a higher energy level than the reactants
- The enthalpy change (ΔH) is positive because products have more energy than reactants
- The difference in height between reactants and products represents the energy absorbed
Think of this as lifting a ball over a hill onto a higher plateau - energy must be supplied to get over the hill and to reach the higher level.
Memory aid: "ENDO means ENTER" - energy enters the system in endothermic reactions, so products are higher in energy.
Key features of energy profiles
Activation energy (Ea)
Activation energy is the minimum energy required for a reaction to occur. On an energy profile:
- Measure Ea vertically from the energy level of the reactants up to the peak of the curve (the highest point on the energy barrier)
- Ea is always a positive value
- A larger Ea means the reaction will proceed more slowly at a given temperature
- All reactions, whether exothermic or endothermic, require some activation energy
Memory aid: "Peak = Ea" - activation energy is always measured from the reactants to the highest peak of the curve, never to the products.
Enthalpy change (ΔH)
Enthalpy change represents the overall energy change of the reaction. On an energy profile:
- Measure ΔH vertically from the energy level of the reactants to the energy level of the products
- For exothermic reactions, ΔH is negative (products lower than reactants)
- For endothermic reactions, ΔH is positive (products higher than reactants)
- The magnitude of ΔH tells you how much energy is released or absorbed
Memory aid: "Start to finish = ΔH" - enthalpy change is measured from the start (reactants) to the finish (products), ignoring the peak completely.
Energy profiles always show energy increasing as you move up the page. This standard convention ensures consistent interpretation across all diagrams.
Effect of catalysts on energy profiles
Catalysts are substances that speed up chemical reactions without being consumed themselves. Understanding how they work is essential for both industrial processes and biological systems.
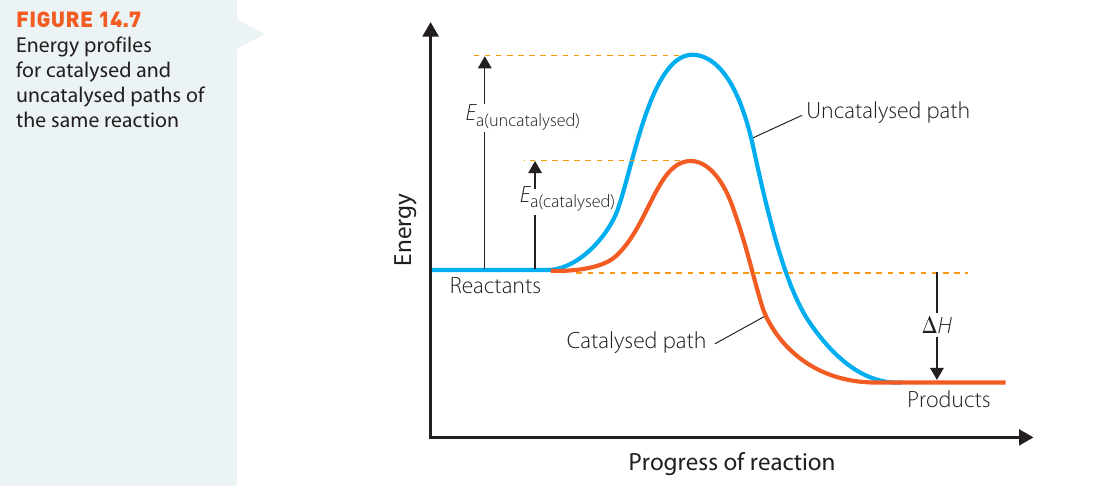
How catalysts affect energy profiles
When a catalyst is added to a reaction:
- The catalyst provides an alternative pathway with a lower activation energy
- The catalyzed pathway appears as a curve with a lower peak on the energy profile
- The activation energy decreases:
What catalysts don't change
This is a crucial point that many students find surprising:
- Catalysts have absolutely no effect on the enthalpy change (ΔH)
- Both the catalyzed and uncatalyzed reactions have exactly the same ΔH value
- The reactants start at the same energy level in both cases
- The products end at the same energy level in both cases
- Only the pathway between reactants and products is different
This is a common exam mistake: Students often think catalysts change the enthalpy change - they don't! Catalysts make reactions go faster by lowering the energy barrier, but they don't change how much energy is ultimately released or absorbed.
Memory aid: "Catalysts cut corners" - they provide a lower path (lower Ea) but reach the same destination (same ΔH).
Why this matters: Think of it as taking a tunnel through a mountain (catalyzed) versus climbing over it (uncatalyzed) - both routes get you to the same destination with the same change in altitude, but one is much easier and faster.
Interpreting energy profile diagrams
Being able to extract information from energy profile diagrams is an essential exam skill. Let's practice with some specific examples.
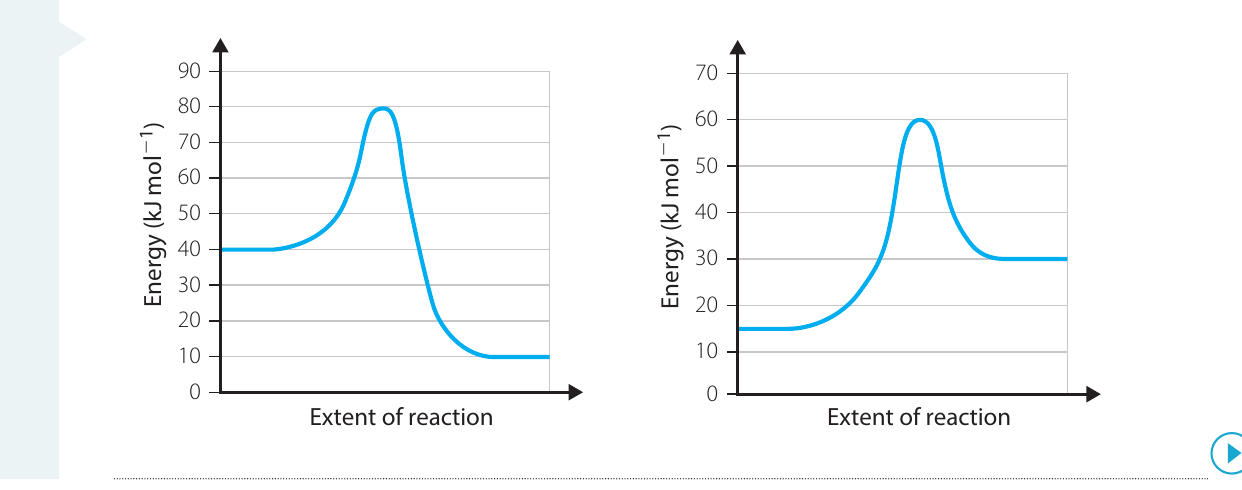
Reading numerical values
When given an energy profile with numerical values, you need to identify three key energy levels: reactants, peak, and products.
Worked Example: Analyzing an Exothermic Reaction (Left Diagram)
Step 1: Identify the energy levels
- Reactants start at approximately
- Peak (maximum energy) is at approximately
- Products end at approximately
Step 2: Calculate the activation energy (Ea)
Step 3: Calculate the enthalpy change (ΔH)
Step 4: Identify the reaction type This is an exothermic reaction because ΔH is negative (products are lower in energy than reactants).
Worked Example: Analyzing an Endothermic Reaction (Right Diagram)
Step 1: Identify the energy levels
- Reactants start at approximately
- Peak (maximum energy) is at approximately
- Products end at approximately
Step 2: Calculate the activation energy (Ea)
Step 3: Calculate the enthalpy change (ΔH)
Step 4: Identify the reaction type This is an endothermic reaction because ΔH is positive (products are higher in energy than reactants).
Exam tips
When working with energy profile diagrams:
- Always clearly identify the energy levels of reactants, the peak, and products
- Use a ruler to help read values accurately from the scale
- Remember: Ea is always measured from reactants to peak (always positive)
- Remember: ΔH is measured from reactants to products (can be positive or negative)
- Check the sign of ΔH to determine if the reaction is exothermic (negative) or endothermic (positive)
- Show all working clearly in your calculations
Common mistake to avoid: Don't confuse the activation energy with the enthalpy change. Ea always goes to the peak, while ΔH always goes to the products. They are measuring completely different things!
Key Points to Remember:
-
An energy profile shows how energy changes as a reaction progresses from reactants to products
-
Exothermic reactions have products at lower energy than reactants (ΔH negative), while endothermic reactions have products at higher energy (ΔH positive)
-
Activation energy (Ea) is measured from reactants up to the peak of the energy barrier - it represents the minimum energy needed for the reaction to occur
-
Enthalpy change (ΔH) is measured from reactants to products - it represents the overall energy change
-
Catalysts lower the activation energy by providing an alternative pathway, but they never change the enthalpy change (ΔH) of a reaction
Quick memory aids:
- "Peak = Ea" (reactants to peak)
- "Start to finish = ΔH" (reactants to products)
- "Catalysts cut corners" (lower Ea, same ΔH)
- "EXO = EXIT" (energy exits, products lower)
- "ENDO = ENTER" (energy enters, products higher)