Meaning of ‘Rate of Reaction’ (HSC SSCE Chemistry): Revision Notes
Meaning of 'Rate of Reaction'
Introduction to reaction rates
Chemical reactions happen at varying speeds. Some reactions are extremely fast, such as explosions at mining sites or the inflation of airbags in cars. These reactions occur almost instantaneously. Other reactions proceed at a moderate pace, such as precipitation reactions or combustion reactions. Some reactions are very slow, taking months or years to complete, such as the rusting of metal objects.
Understanding how fast reactions occur is crucial in chemistry. The speed of a chemical reaction is referred to as its rate of reaction. This chapter explores what this term means and how we can measure and describe it quantitatively.
Real-World Examples of Reaction Speeds:
- Fast reactions: Fireworks, combustion in engines, neutralization reactions
- Medium-speed reactions: Most precipitation reactions, acid-base reactions
- Slow reactions: Rusting of iron, weathering of rocks, ripening of fruit
Simple definition: Measuring time to completion
One straightforward way to measure the rate of a chemical reaction is to determine how long the reaction takes to finish. When we measure reaction rates this way, shorter times indicate faster reactions, while longer times indicate slower reactions.
Consider the example of indigestion tablets dissolving in water. When these tablets are placed in water at different temperatures, they dissolve at different rates.
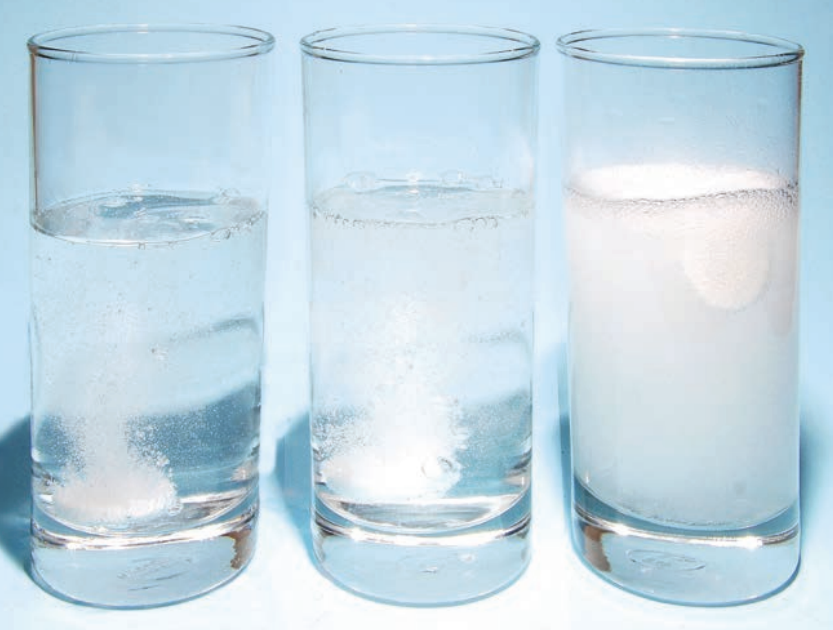
The data below shows how temperature affects the dissolution rate:
| Temperature (°C) | 13 | 24 | 41 |
|---|---|---|---|
| Time for bubbling to stop (s) | 78 | 42 | 22 |
As the temperature increases, the time required for the reaction to complete becomes shorter. This tells us that the rate of reaction increases with temperature. At , the reaction takes seconds to complete, but at , it takes only seconds. The reaction is much faster at the higher temperature.
Common Mistake to Avoid:
When comparing reaction rates using time measurements, remember that a shorter time means a faster rate. Students often confuse these - don't mix them up! Think of it as an inverse relationship: as time decreases, rate increases.
Precise definition: Rate of change in concentration
While measuring the time for a reaction to complete is useful, chemists need a more precise definition. The rate of reaction refers to the rate at which reactants are consumed or the rate at which products form in a chemical reaction.
This definition allows us to track the progress of a reaction at any point in time, not just when it finishes. Let's examine a specific example to understand this better.
Example: Nitric oxide reacting with oxygen
When nitric oxide () reacts with oxygen (), it forms nitrogen dioxide ():
This reaction is particularly useful for studying rates because we can observe it visually. Nitric oxide is colourless, while nitrogen dioxide is brown. As the reaction proceeds, the brown colour intensifies, allowing us to track the increasing concentration of the product.
Visual Demonstration: NO + O₂ Reaction
This reaction provides an excellent visual representation of rate:
- Start: Colourless gas mixture (NO and O₂)
- During reaction: Gradually increasing brown colour
- End: Dark brown colour (NO₂)
The intensity of brown colour is directly proportional to NO₂ concentration, making it easy to observe concentration changes over time.
We can measure how the concentration of nitrogen dioxide changes over time and plot this on a graph. Similarly, we can measure how the concentration of nitric oxide (the reactant) decreases over time.
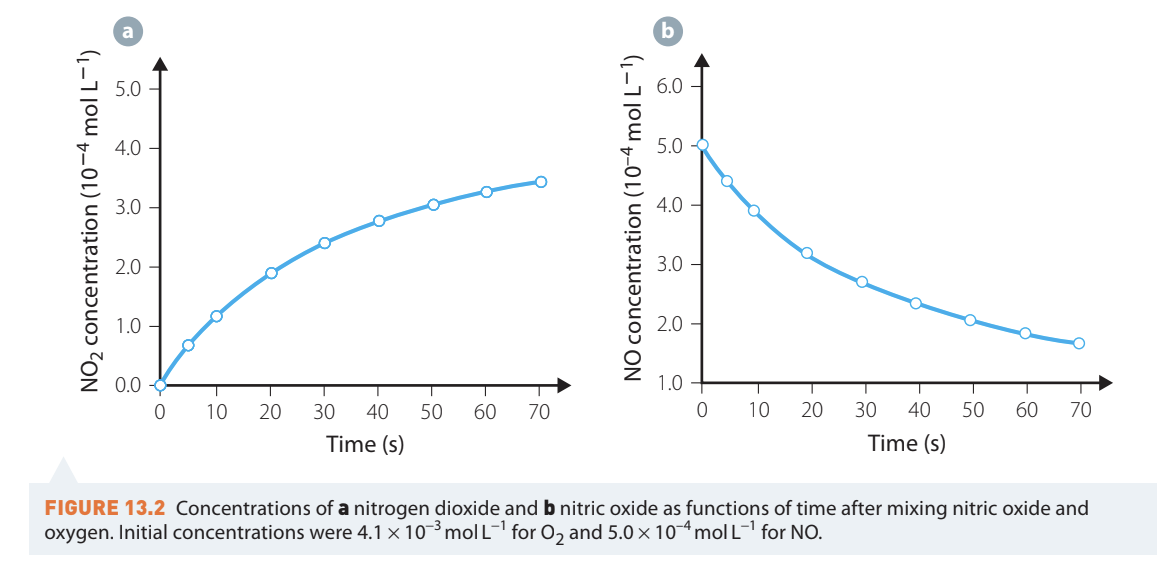
These graphs show typical concentration-time curves for a chemical reaction. Graph (a) shows the product concentration increasing, while graph (b) shows the reactant concentration decreasing. Both graphs provide information about the reaction rate.
Mathematical expression of rate
The rate of reaction can be expressed mathematically. The average rate of reaction over a time interval is calculated as:
If the concentration changes from at time to at time , then:
Chemists often use the Greek letter delta () to represent "change in". Using this notation:
where and .
Understanding the Delta () Symbol:
The symbol (delta) is Greek for "change in" and is commonly used in chemistry and mathematics. When you see , read it as "change in concentration" or "delta c". This notation makes equations more concise and easier to read.
For example:
- = change in concentration = (final concentration - initial concentration)
- = change in time = (final time - initial time)
The units for rate of reaction are typically (moles per litre per second), which represents the change in concentration per unit time.
Interpreting concentration-time graphs
Concentration-time graphs provide valuable information about reaction rates. The key to understanding these graphs is recognising that the rate of reaction at any particular time is the gradient (slope) of the curve at that time.
Understanding gradient and rate
Looking at the concentration-time graph for nitrogen dioxide formation (graph a in Figure 13.2):
- At the beginning of the reaction, the curve is steep, indicating a fast rate
- As time progresses, the curve becomes less steep (flattens out)
- This shows that the rate of reaction decreases as the reaction proceeds
The gradient of the curve tells us the instantaneous rate at that moment. A steep gradient means a fast rate, while a gentle gradient means a slow rate.
Memory Aid: "Steep = Speedy"
Remember that the steepness of the curve corresponds to the speed of the reaction:
- Steep slope → Fast rate → Reaction proceeding quickly
- Gentle (flat) slope → Slow rate → Reaction proceeding slowly
- Horizontal line (zero slope) → Zero rate → Reaction has stopped
Product versus reactant graphs
When we plot the concentration of a product against time, the curve slopes upward because the product concentration increases as the reaction proceeds. The rate of reaction is simply the gradient of this upward-sloping curve.
When we plot the concentration of a reactant against time, the curve slopes downward because the reactant concentration decreases as it is consumed. In this case, the gradient is negative. However, we always express reaction rate as a positive value, so we take the magnitude (absolute value) of the gradient. This means we ignore the negative sign and use only the size of the slope.
Critical Concept: Rate is Always Positive
Even though reactant concentration-time graphs have a negative gradient (downward slope), we always report reaction rate as a positive number. We use the magnitude (absolute value) of the gradient:
- Product graph: Positive slope → Rate = gradient
- Reactant graph: Negative slope → Rate = |gradient| (ignore the minus sign)
This convention ensures that rate values are always positive, regardless of whether we're measuring reactant consumption or product formation.
Why does rate decrease during a reaction?
You may have noticed that in both graphs, the curve becomes less steep as time progresses. This is a general characteristic of chemical reactions: the rate of reaction typically decreases as the reaction proceeds.
This happens because as reactants are consumed, their concentrations decrease. With fewer reactant molecules present, there are fewer opportunities for successful collisions that lead to product formation. The reaction therefore slows down over time.
Practical investigation: The disappearing cross experiment
A classic experiment used to demonstrate reaction rates involves the reaction between sodium thiosulfate and hydrochloric acid:
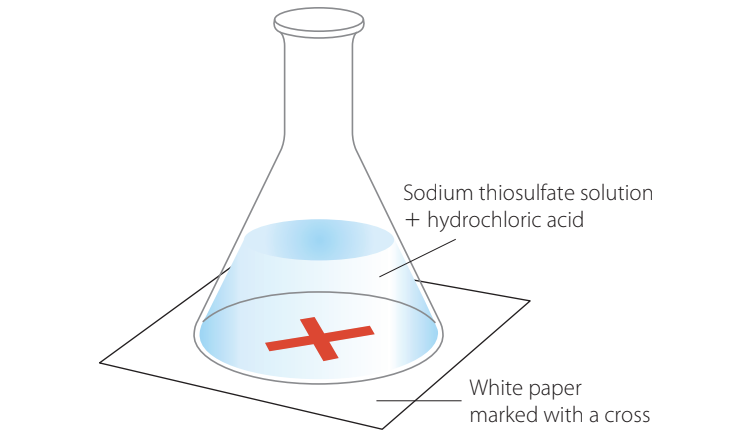
Experimental Setup:
In this experiment, a flask containing sodium thiosulfate solution is placed over a piece of white paper marked with a cross. When hydrochloric acid is added, sulfur (a cloudy yellow solid) gradually forms as a precipitate. The reaction rate is measured by timing how long it takes for the cross to disappear from view when looking down through the flask.
This investigation can be used to study how different factors affect reaction rate:
- Temperature: Performing the experiment at different temperatures shows how rate changes with temperature
- Concentration: Using different concentrations of sodium thiosulfate shows how rate depends on reactant concentration
The shorter the time for the cross to disappear, the faster the reaction rate. This simple but effective method allows students to collect quantitative data about reaction rates.
Safety Note:
This experiment produces sulfur dioxide gas, which is an irritant, so it must be performed in a well-ventilated area or fume cupboard.
Summary
Key Points to Remember:
-
Rate of reaction measures how quickly a chemical reaction proceeds. It can be expressed as either the rate of reactant consumption or the rate of product formation.
-
A simple way to compare rates is by measuring the time to completion. Shorter times indicate faster reactions, and longer times indicate slower reactions.
-
The precise definition uses concentration changes: average rate = , where is the change in concentration and is the time interval.
-
On a concentration-time graph, the rate of reaction at any moment is the gradient (slope) of the curve. A steep slope indicates a fast rate, while a gentle slope indicates a slow rate.
-
Reaction rates typically decrease as reactions proceed because reactant concentrations decrease over time, leading to fewer successful molecular collisions.
-
Rate is always expressed as a positive value, even when calculated from reactant consumption graphs with negative gradients.