Trends in the Distribution of Income and Wealth (HSC SSCE Economics): Revision Notes
Trends in the Distribution of Income and Wealth
Introduction to income and wealth trends
Australia has experienced a modest increase in overall inequality in recent decades. This inequality affects different groups in society to varying degrees, depending on several key factors: age, education, gender, occupation, ethnic background, family structure, and geographic location.
Understanding these trends helps us identify which groups face economic disadvantage and why certain patterns of inequality persist over time. This knowledge is essential for developing effective policy responses and promoting greater equity in Australian society.
Distribution patterns: income versus wealth
Income distribution in Australia
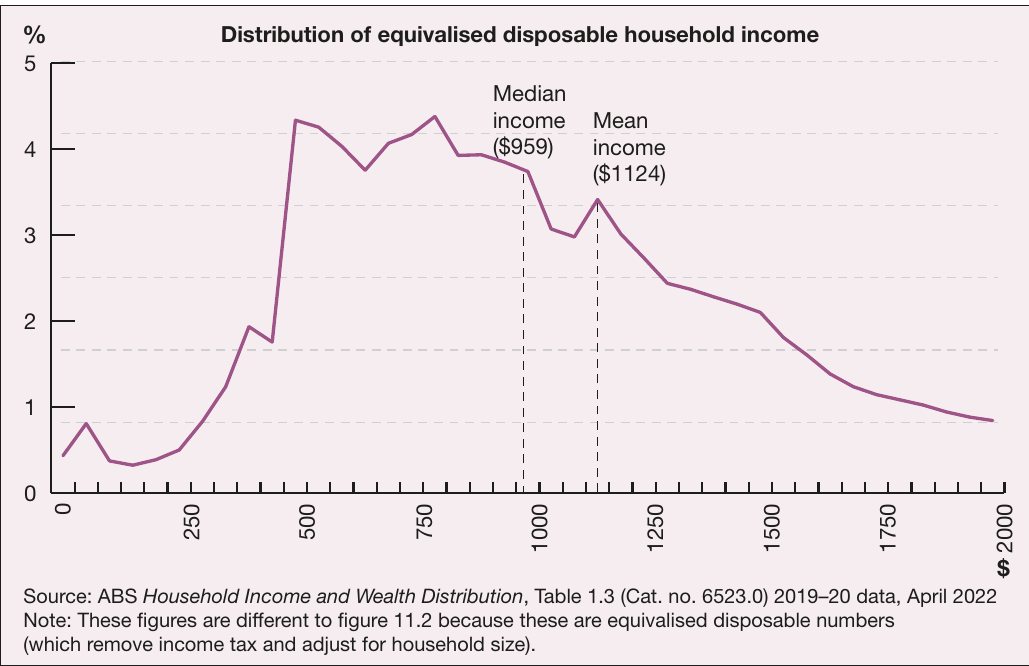
Income distribution in Australia shows significant inequality. The majority of households have weekly disposable incomes below $900, which is substantially lower than the mean (average) income.
Key features of income distribution:
- The median income ($959) is lower than the mean income ($1124)
- This gap indicates an asymmetric distribution
- A small number of households have very high incomes
- A large number of households have relatively low incomes
- Over half the population earns less than the mean income
The distribution is described as "right-skewed" because it has a long tail extending toward higher income values. This shape tells us that high-income earners pull the average up, even though most people earn less than this average. When the mean is significantly higher than the median, it signals concentration of income at the top end.
Wealth distribution in Australia
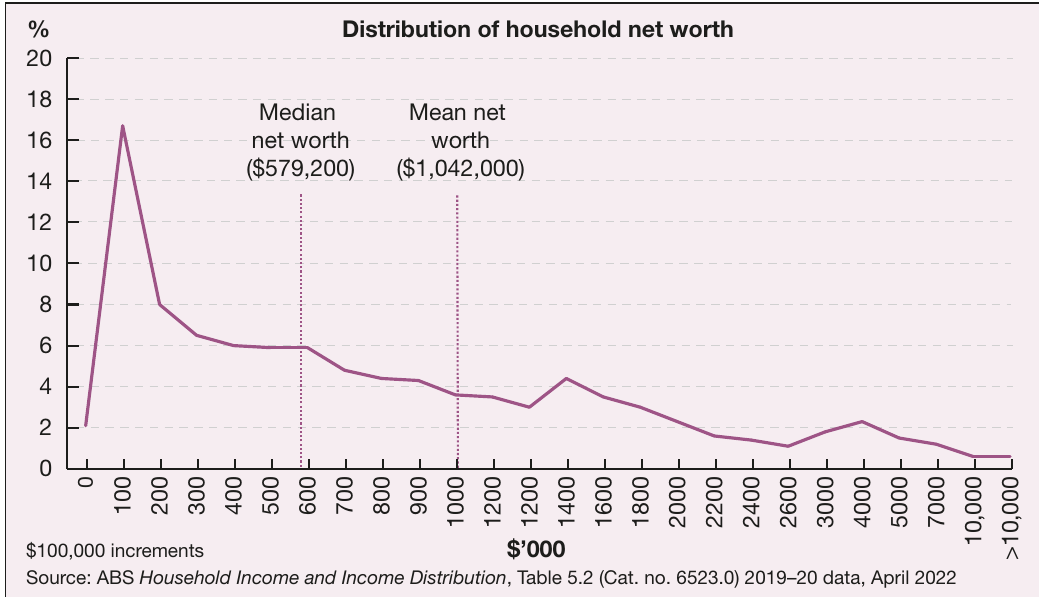
Wealth inequality is even more pronounced than income inequality. The distribution of household net worth shows that wealth is highly concentrated among a small proportion of households.
Key features of wealth distribution:
- More than 80% of households have net worth below the mean
- The median net worth is $579,200
- The mean net worth is $1,042,000 (much higher than median)
- The wealth gap is far greater than the income gap
Understanding the extreme inequality:
- The lowest 20% of households have mean net worth of $35,100
- The wealthiest 20% have mean net worth of $3.3 million
- This means the richest 20% have wealth approximately 94 times greater than the poorest 20%
- To be in the wealthiest 1%, a household must have net assets exceeding $6 million
The fact that wealth is more unequally distributed than income reflects how wealth accumulation works: those with higher incomes can save and invest more, leading to exponential growth in their wealth over time. This creates a compounding effect where initial advantages become magnified over the years.
Age and income distribution
Income levels vary significantly across different age groups. This variation reflects life-cycle patterns of employment, education, experience, and career progression.
Income by age group
Trends across age groups:
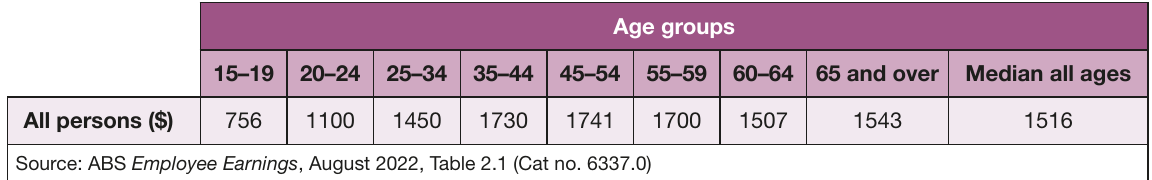
- Youngest workers (15-19 years) earn the lowest median weekly income at $756
- Income rises steadily through the 20s and 30s as workers gain experience and qualifications
- Peak earning years occur between ages 45-54 ($1741 per week)
- Income remains relatively high through ages 55-64
- The median across all ages is $1516
Why do younger workers earn less?
- Less education and fewer qualifications
- Limited work experience
- Entry-level positions with lower pay
- Higher likelihood of casual or part-time employment
- These job types typically pay less even when hours are taken into account
The generational wealth gap
Age-based inequality has widened significantly due to rapid housing price increases in the 2000s and beyond. Research by the Grattan Institute found that older households are now on average four times as wealthy as younger households.
Wealth changes by age group (2002-2019):
- People over 65: Real median net wealth increased by almost 70%
- People aged 25-34: Real median net wealth increased by just 3%
- This gap has widened further since 2019 due to continued housing price growth
This generational divide has important implications for social mobility and inequality, as younger Australians find it increasingly difficult to accumulate wealth compared to previous generations at the same age.
Education and income
Educational qualifications have a strong positive relationship with income levels. Higher qualifications consistently lead to higher earnings across the workforce.
Income by qualification level
Earnings hierarchy by education:
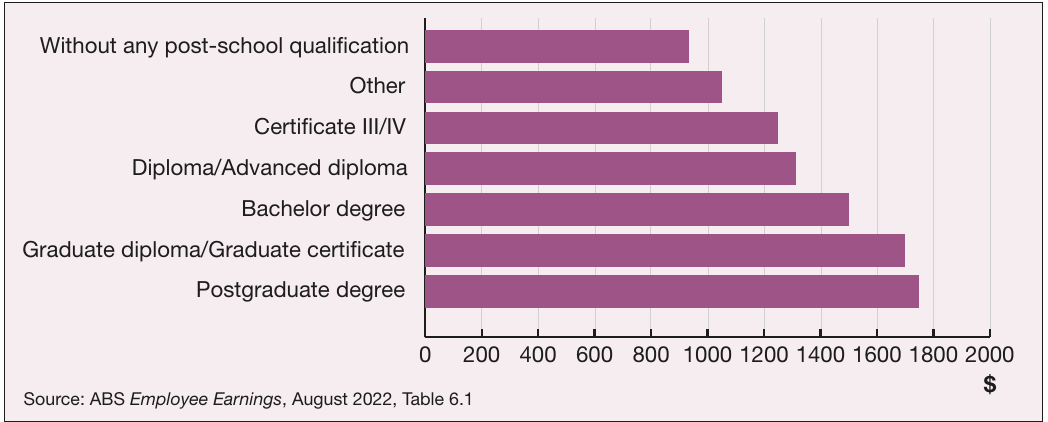
- Postgraduate degree: $1750 per week (highest)
- Graduate diploma/certificate: Approximately $1650 per week
- Bachelor degree: Approximately $1550 per week
- Diploma/Advanced diploma: Approximately $1450 per week
- Certificate III/IV: Approximately $1350 per week
- Other qualifications: Approximately $1150 per week
- No post-school qualification: $934 per week (lowest)
The education premium:
- On average, employees with post-school qualifications earn $1424 per week
- This is $490 higher than those without post-school qualifications
- The education premium increases with the level of qualification
- This gap reflects the higher-skilled, higher-paid jobs available to qualified workers
These patterns demonstrate why education is considered a key pathway to higher income and reduced inequality. However, access to education itself can be unequal, creating a cycle where disadvantage is passed between generations. Breaking this cycle requires both ensuring access to quality education and addressing other barriers that prevent disadvantaged students from completing their qualifications.
Gender and income inequality
Gender remains a significant factor in income distribution. Despite decades of progress, a persistent pay gap exists between male and female workers.
The gender pay gap over time
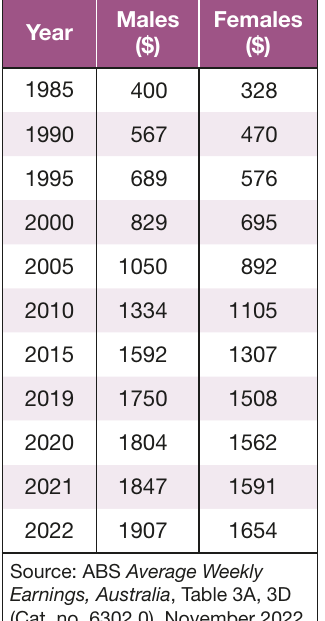
The gender pay gap has narrowed slowly over the past four decades, but progress has been gradual:
Historical trends:
- 1985: Women earned 82% of male earnings ($328 vs $400 per week)
- 2022: Women earned 87% of male earnings ($1654 vs $1907 per week)
- This represents only a 5 percentage point improvement over 37 years
In 2022, the average weekly earnings gap was $253, meaning women earn on average $13,156 less per year than men for full-time work. This persistent gap has significant long-term implications for women's lifetime earnings, wealth accumulation, and retirement security.
Gender pay gap by industry
The pay gap exists across all industries, including those dominated by female workers.
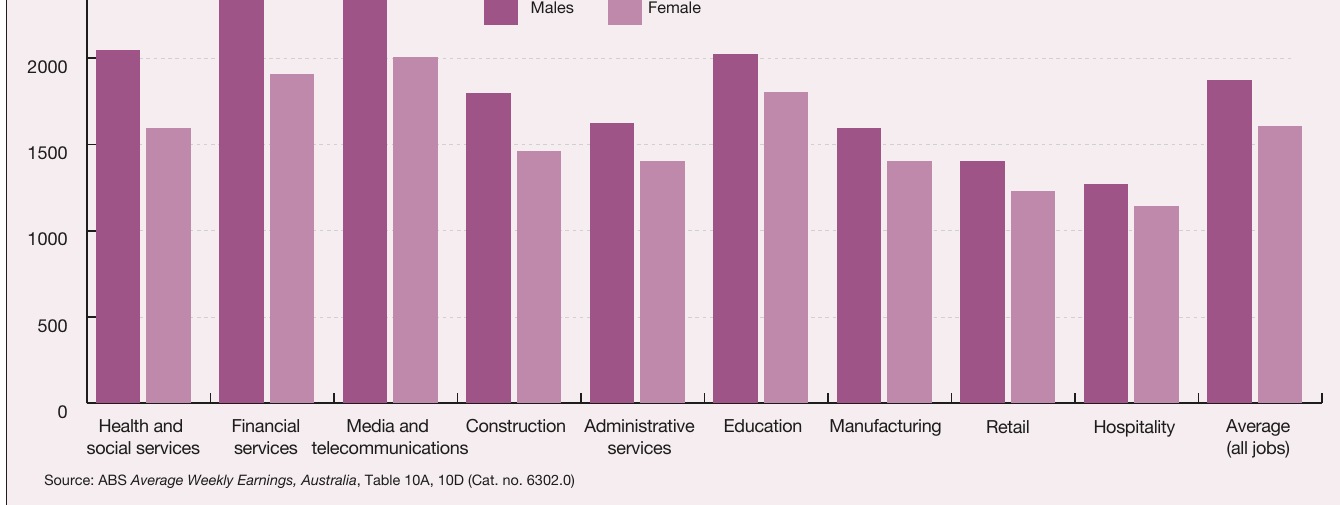
Key findings:
- Women earn on average $256 per week less than men across all industries
- The gap exists even when comparing the same industries and occupations
- Some of the largest gaps occur in female-dominated industries like health and social services
- This suggests discrimination persists beyond occupational differences
Causes of the gender pay gap
Occupational factors:
- Female-dominated occupations generally have lower wages
- Women have greater home caring responsibilities in many families
- Fewer senior roles available for part-time workers (a higher proportion of women work part-time)
- Women take longer career breaks, affecting career progression
Discrimination:
- Even after accounting for qualifications, experience, and occupation, women still earn less
- This indicates ongoing direct and indirect discrimination in the workplace
The superannuation gap
The income gap extends into retirement through lower superannuation balances:
Superannuation inequality:
- Women who work full-time throughout their careers have balances 17% lower than men
- Including casual and part-time workers, the gender gap rises to 33%
- This reflects lower wages, longer career breaks, and the fact that employers don't make superannuation payments during parental leave
Case study: the gig economy and gender inequality
Approximately 250,000 Australians work in the "gig economy" through digital platforms for food delivery, ride-sharing, and other services. Research shows the gig economy may be exacerbating gender inequality:
Gender disparities in platform work:
Research findings show significant gender gaps in the gig economy:
- 45% of gig economy workers earn below the minimum wage
- Women earn approximately 30% less than men per week
- Women earn $2.67 less per hour than men
Contributing factors:
- Women concentrate in lower-paid platform jobs like care work
- Men concentrate in higher-paid work like software development
- Women's caring responsibilities reduce available working time
- Platform algorithms may discriminate by preferencing workers who work more frequently
This suggests that new forms of work may reproduce and even amplify existing patterns of inequality rather than creating more equal opportunities.
Ethnic and cultural background
Australia's multicultural population shows some variation in economic outcomes based on country of birth and language background.
Migration and the Australian population
Demographic context:
- Almost half the population has a direct migration connection
- 30% are first-generation Australians (born overseas)
- 19% are second-generation (at least one parent born overseas)
- Almost 60% of migrants come from non-English-speaking countries
Employment outcomes by migration status
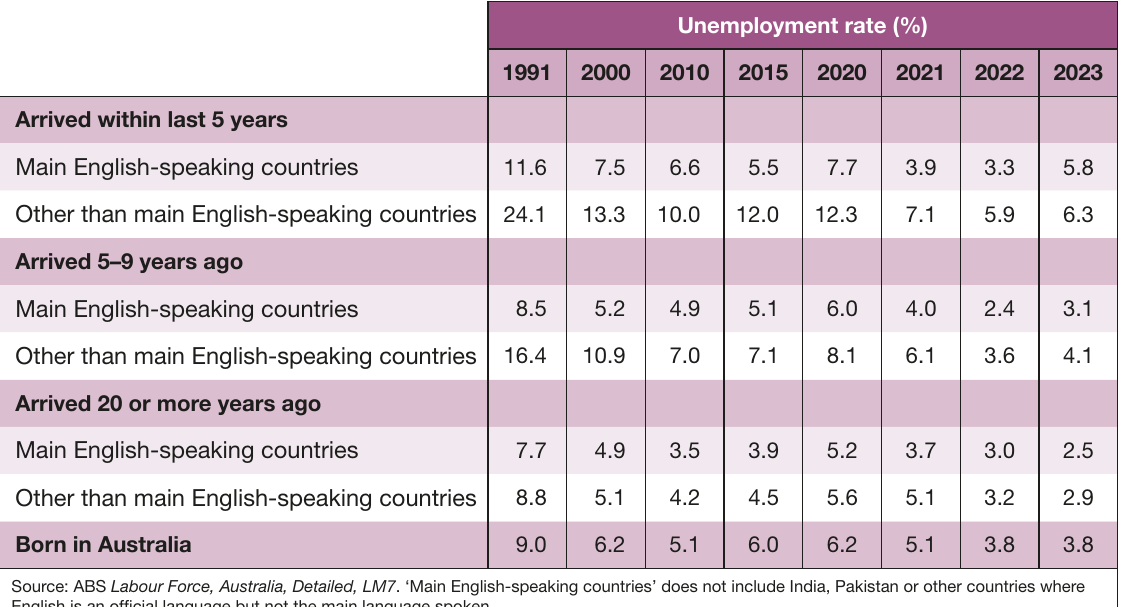
Unemployment patterns:
- Recent migrants (arrived within 5 years) have higher unemployment rates
- This is especially true for migrants from non-English-speaking countries
- In the short term (first 5 years), unemployment can be 2-3 times higher than for Australian-born workers
- Long-term (20+ years), unemployment rates converge to similar levels
Differences by English language background:
- Migrants from English-speaking countries have lower unemployment rates
- They are more likely to be highly skilled and professionally qualified
- Recent migrants from non-English-speaking countries face higher barriers to employment
These patterns reflect the challenges of language acquisition, credential recognition, and establishing professional networks in a new country.
Income and participation
Labour force participation:
- Skilled migrants have high participation rates
- Migrants who have been in Australia 10-14 years have participation rates around 80%
- This is substantially higher than Australia's population average of 67%
Income levels:
- Median annual income for migrants: $45,351 (2019-20)
- Population median: $52,338 (slightly higher)
- English-speaking migrants earn between $1193-$3979 more than Australian workers
- Non-English-speaking migrants earn around $8000 less per year
- Non-English-speaking migrants also have significantly less wealth
Barriers to employment:
- Underemployment is around 20% for non-English-speaking migrants
- This compares to 12% for English-speaking migrants
- Barriers likely include English proficiency and recognition of overseas qualifications
- Despite these challenges, Australia ranks 8th out of 38 economies for migrant integration
Indigenous Australians and economic disadvantage
Indigenous Australians experience significantly lower levels of income and wealth compared to the broader population, alongside multiple indicators of disadvantage.
Demographic profile
Population characteristics:
- Indigenous Australians comprise 3.2% of the population (812,000 people)
- One-third live in major cities; two-thirds in remote or regional areas
- Largest populations in NSW (34%) and Queensland (29%)
- Significantly younger population: average age 23 vs 38 for general population
- Life expectancy is 8 years lower than non-Indigenous Australians
Economic indicators
Income and wealth:
- Indigenous households have median weekly income of $830
- This compares to $1200 for the population overall
- This represents a significant 31% income gap
Homelessness:
- One in five Australians experiencing homelessness in 2021 were Indigenous
- Total of 24,930 Indigenous people experiencing homelessness
- This is hugely disproportionate given Indigenous people are only 3.2% of the population
Employment:
- Indigenous employment rate increased from 47% to 52% between 2016-2021
- Non-Indigenous employment rate was stable at 76%
- This represents a 24 percentage point employment gap
Education:
- Indigenous school attendance rate: 79.4% (Years 1-10, 2022)
- Non-Indigenous attendance: 91.6%
- This 12 percentage point gap affects educational outcomes and future employment prospects
COVID-19 impacts
The pandemic highlighted existing vulnerabilities:
- Indigenous Australians were almost twice as likely to be on income support (57% vs 27%)
- More than half reported living in households experiencing financial stress
Progress and policy responses
Closing the Gap initiatives:
- Since 2008, Australian governments have committed to strategies aimed at closing gaps between Indigenous and non-Indigenous Australians
- Some progress has been made, particularly in life expectancy and infant mortality
Positive trends (2007-2017):
- Life expectancy increased by 4.1 years for boys and 2.5 years for girls
- Infant mortality fell from 13 to 5 deaths per 1000
However, the complexity of Indigenous disadvantage requires ongoing comprehensive policy responses across health, education, housing, and economic participation.
Family structure and inequality
Family composition significantly influences both income and wealth levels. Recent demographic changes have amplified these effects.
Demographic changes affecting inequality
Key trends:
- Increased female workforce participation
- Decreasing family sizes (fewer children per household)
- Growing proportion of people living alone
- Later marriage and child-bearing
- Higher rates of family breakdown
Income and wealth by family type
Income patterns:
- Couples without dependent children: $1148 per week (highest)
- Couples with dependent children: $1007 per week
- Single persons: $718 per week
- Single parents: $686 per week (lowest)
- All households average: $958 per week
Wealth patterns:
- Couples without dependent children: $1,150,300 net worth (highest)
- Couples with dependent children: $699,000 net worth
- Single persons: $389,100 net worth
- Single parents: $151,000 net worth (lowest)
- All households average: $579,200 net worth
Understanding single-parent disadvantage
Income challenges:
- Single-parent households earn approximately one-third below the average
- Only 14% of single parents with children under 4 work full-time
- As children grow older, single parents increase working hours but still work fewer hours than couples
- 40% of single-person households are in the bottom income quintile
- Lower employment rates driven by caring responsibilities
Wealth disparities:
- Single-parent households have by far the lowest net worth ($151,000)
- This is approximately one-quarter of the national average
- This reflects lower incomes, fewer opportunities to save, and less time to accumulate assets
The single-person household paradox
An interesting pattern emerges when comparing single-person and single-parent households:
- Single persons have similar weekly incomes to single parents
- However, single persons have much higher wealth ($389,100 vs $151,000)
Explanation:
- Many single-person households are "income-poor but asset-rich" elderly people
- These retirees have paid off mortgages and own their homes outright
- They live on modest government pensions or retirement incomes
- Their low income is offset by accumulated housing wealth
Age and family structure interactions
The relationship between age and family structure complicates interpretation:
- Couples with children are more likely to be in peak earning years (35-54)
- Single-person households include many retirees with low incomes but high wealth
- These overlapping factors mean family structure and age must be considered together when analyzing inequality
Geographic inequality
Significant disparities exist in income and wealth across different regions of Australia, both between states and within states.
Income inequality between states and territories
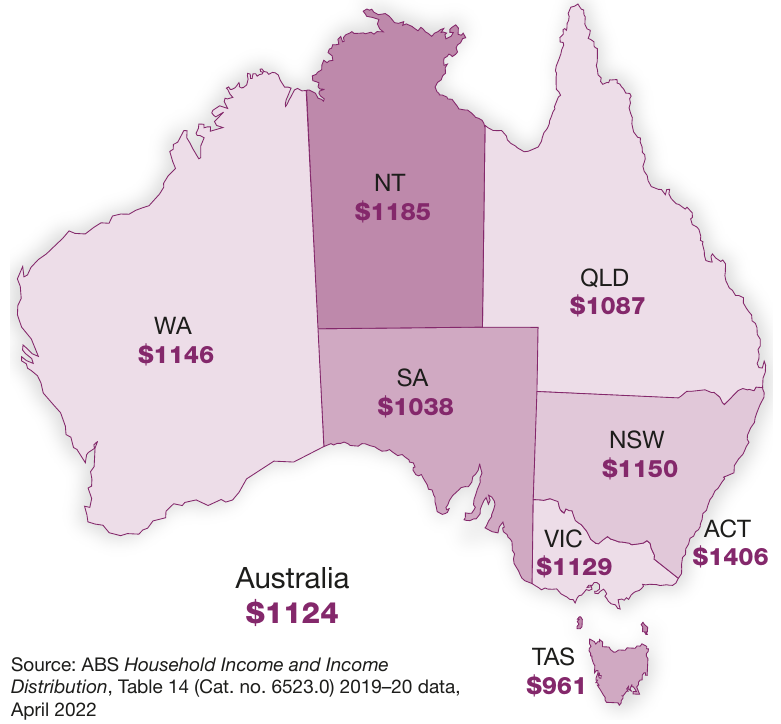
State and territory income rankings (mean disposable income per week):
- Australian Capital Territory: $1406 (highest)
- Northern Territory: $1185
- New South Wales: $1150
- Western Australia: $1146
- Victoria: $1129
- Queensland: $1087
- South Australia: $1038
- Tasmania: $961 (lowest)
- National average: $1124
Factors explaining state differences:
- Mining activity: WA and NT benefit from mining sector wages
- Age demographics: Younger populations (ACT, NSW) have higher average incomes
- Industry mix: Different states have different concentrations of high and low-paid industries
- Cost of living: These figures don't account for regional cost differences
Regional inequality: cities versus rural areas
Income and wealth gaps exist within states, particularly between capital cities and regional areas.
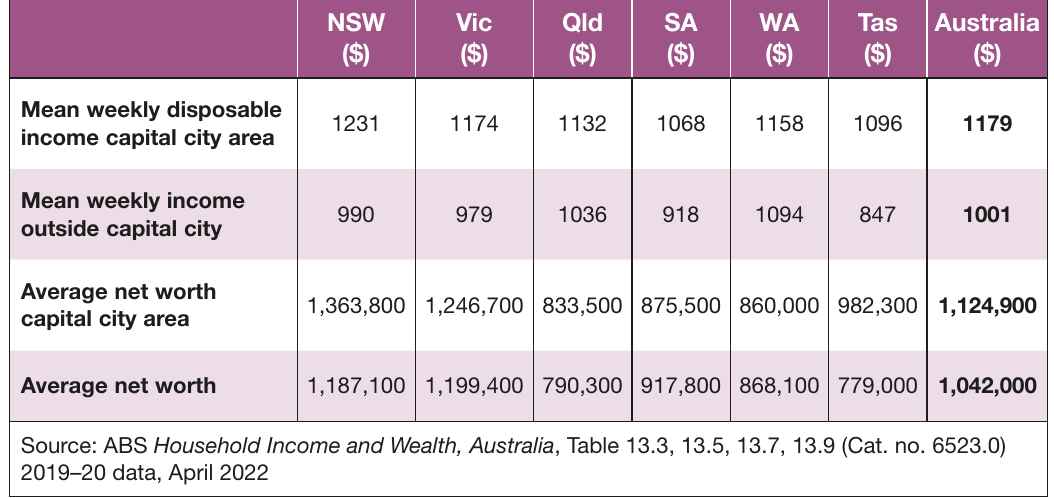
Capital city premium:
- NSW: Capital city residents earn 24% more than those in rest of state ($1231 vs $990)
- Victoria: Capital city advantage of 20% ($1174 vs $979)
- Queensland: Capital city advantage of 9% ($1132 vs $1036)
- South Australia: Capital city advantage of 16% ($1068 vs $918)
- Western Australia: Capital city advantage of 6% ($1158 vs $1094)
- Tasmania: Capital city advantage of 29% ($1096 vs $847)
Wealth differences:
- Sydney households: Average net worth $1,363,800
- Rest of NSW: Average net worth $1,187,100
- Sydney properties average $1.2 million vs $695,000 in rest of NSW
Understanding geographic inequality:
- Major cities concentrate higher-paid jobs across professional and financial services
- Property values drive wealth accumulation differently across regions
- Access to services, infrastructure, and opportunities varies by location
Cost of living considerations
Raw income comparisons can exaggerate true inequality because living costs vary significantly:
Example: Sydney versus Adelaide (2023):
- Average weekly rent in Sydney: $711
- Average weekly rent in Adelaide: $534
- This $177 difference means similar incomes provide different living standards
Geographic inequality has important policy implications for regional development, infrastructure investment, and ensuring opportunities exist beyond major metropolitan areas.
Persistent local inequality
Research by the Committee for Economic Development of Australia (2018) found:
- Half of NSW's most disadvantaged regions concentrated in just 6% of the state (37 postcodes)
- This geographical inequality had barely changed since 2007
- This persistence suggests structural factors maintain regional disadvantage over time
Social mobility: the land of unequal opportunities?
While Australians often view their country as offering equal opportunities, evidence suggests significant barriers to social mobility exist.
Intergenerational transmission of advantage
One of the strongest predictors of future qualifications, occupation, and income is parental background. Just as wealth is passed between generations, so too are education levels and income levels.
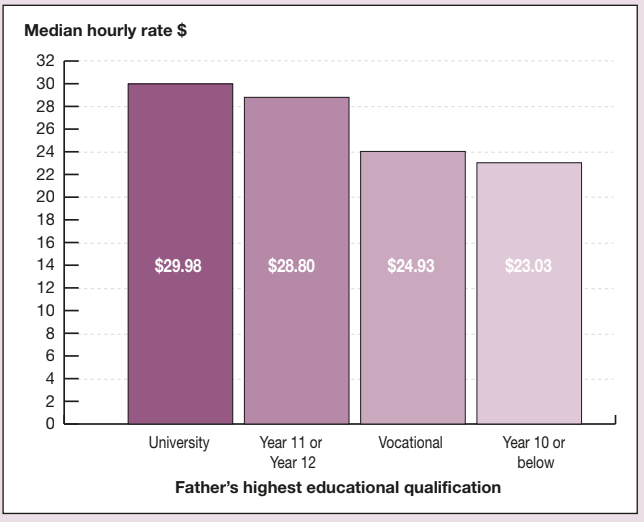
Father's education and children's earnings:
- Children whose fathers completed university: $29.98 per hour
- Children whose fathers completed Year 11-12: $28.80 per hour
- Children whose fathers had vocational training: $24.93 per hour
- Children whose fathers completed Year 10 or below: $23.03 per hour
This represents a 30% earnings difference between those with university-educated fathers versus those whose fathers had minimal education.
Competing perspectives on inequality
Two major reports published in recent years reached different conclusions about inequality trends in Australia.
Institute of Public Affairs (2017) - Understanding Inequality in Australia:
Key arguments:
- Problems with rising inequality are often exaggerated
- Different data sources reach different conclusions
- Australia has average or better-than-average inequality levels compared to other developed nations
- Inequality may actually be declining rather than rising
- Greater inequality existed in the pre-1950 period than today
Emphasis on family and community:
- Family values around work and study significantly impact educational outcomes
- Individual choices matter: some people prefer lower income with more leisure time
- Need to look beyond simple income measures to understand wellbeing
Concerns raised:
- Housing affordability is worse than ever (98% want to own homes but can't afford them)
- Australian school results declining internationally in mathematics, science, and reading literacy
Australia Institute (2023) - Inequality on Steroids:
Key findings:
- Increasing concentration of wealth at the top
- Top 10% of income earners secured 93% of income growth in the decade to 2019
- This pattern contrasts with all previous post-WWII periods
- Previously, the bottom 90% received the majority of income growth
Policy recommendations:
- Advocated for more inclusive post-pandemic economic growth
- Warned that current trends risk worsening inequality
International comparison:
- Using the Gini coefficient, Australia ranks 21st out of 38 OECD countries
- This means Australia has slightly more inequality than most OECD economies
- Australia is neither the most equal nor most unequal, but sits in the more unequal half
Implications for policy
These debates highlight that:
- Inequality can be measured in multiple ways
- Different data sources and time periods can lead to different conclusions
- Both individual choices and structural factors contribute to inequality
- Policy responses must address both economic and social factors
- Long-term trends matter more than short-term fluctuations
The relationship between income and wealth
While wealth and income are distinct concepts, they are closely interconnected, with each reinforcing the other over time.
How income creates wealth
The accumulation process:
- Household income pays for goods, services, and debt servicing
- Income remaining after living expenses can be used to acquire assets
- Higher income households have greater capacity to build wealth
- This is particularly true once income exceeds a threshold that covers all necessary expenses
Assets that build wealth:
- Property ownership (primary residence and investment properties)
- Share portfolios and managed investments
- Superannuation balances
- Business ownership
- Savings and term deposits
How wealth creates income
Income from wealth assets:
- Rental income from investment properties
- Dividends from share portfolios
- Interest from savings and bonds
- Capital gains when assets are sold
- These income sources may not be accessible until wealth reaches certain levels
The inequality multiplier effect
The income-wealth relationship creates a reinforcing cycle:
Upward spiral for high-income earners:
- High income allows greater saving and investment
- Wealth accumulation generates additional income
- Combined income (wages + investment returns) grows faster
- This enables even greater wealth accumulation
- The cycle continues, with wealth compounding over time
Downward pressure on low-income earners:
- Low income limits capacity to save
- Little or no wealth accumulation occurs
- No investment income is generated
- Entire income must cover living expenses
- The gap with higher earners widens over time
Generational wealth gaps
This dynamic helps explain growing inequality between age groups:
Productivity Commission research (2020):
- Over 65s experienced above-average income growth after the global financial crisis
- Under 35s experienced below-average income growth over the same period
Source of income growth differed by age:
- For over 65s: Fastest growth came from wealth assets (rent and dividends)
- Their accumulated property and investments generated increasing returns
- This created a significant advantage over younger groups without such assets
Implications:
- Younger Australians face barriers to wealth accumulation
- Rising property prices make it harder to enter the property market
- Without wealth assets, they cannot generate investment income
- This creates a structural disadvantage that may persist through their lifetime
Policy implications
Understanding the income-wealth relationship is crucial for:
- Designing effective redistribution policies
- Addressing housing affordability
- Ensuring younger generations can build wealth
- Considering taxation of different income sources
- Supporting first-home buyers and wealth accumulation for low-income earners
The reinforcing nature of the income-wealth relationship means that inequality, once established, tends to persist and potentially worsen over time without policy intervention.
Remember!
Key Points to Remember:
-
Distribution patterns: Wealth is far more unequally distributed than income in Australia. The mean is significantly higher than the median for both, indicating concentration at the top end. The wealthiest 20% have net worth 94 times that of the poorest 20%.
-
Major inequality factors: Six key factors drive inequality: age (peak earnings 45-54, but younger generations struggle to build wealth), education (postgraduate earners make 87% more than those without post-school qualifications), gender (women earn 87% of male wages despite 40 years of progress), ethnicity (recent non-English-speaking migrants face higher unemployment), family structure (single parents have lowest incomes and wealth), and geography (capital cities earn 6-29% more than regional areas).
-
Persistent disadvantage: Indigenous Australians face significant economic disadvantage with incomes 31% below the national average, employment rates 24 percentage points lower, and greatly disproportionate homelessness. Progress has been slow despite Closing the Gap initiatives.
-
The inequality multiplier: Income and wealth reinforce each other in a cycle. High income enables wealth accumulation, which then generates investment income, compounding advantage over time. This explains why over 65s have wealth four times that of younger households.
-
Social mobility barriers: Intergenerational transmission of advantage is strong - children of university-educated fathers earn 30% more than those whose fathers had minimal education. While Australia ranks middle among OECD nations for inequality, debate continues about whether inequality is rising or falling and what policies are most effective.