The Production Possibility Frontier (HSC SSCE Economics): Revision Notes
The Production Possibility Frontier
Understanding the production possibility frontier
The production possibility frontier (PPF), also called the production possibility curve, is a fundamental economic model that helps us understand the choices societies face when allocating scarce resources. The PPF illustrates all possible production combinations of two goods that an economy can achieve when using its resources efficiently.
The PPF is one of the most important analytical tools in economics because it simultaneously demonstrates the concepts of scarcity, choice, opportunity cost, and efficiency in a single visual framework.
Key definition: A production possibility frontier is a graphical representation of all the possible combinations of the production of two goods or services that an economy can produce at any given time, given its available resources and technology.
The PPF demonstrates a crucial economic principle: producing more of one good requires producing less of another. This trade-off exists because resources are limited and must be allocated between competing uses. When an economy operates on its PPF, it is achieving productive efficiency by using all available resources to their full capacity.
Assumptions of the PPF model
To construct and understand a basic PPF, economists make several simplifying assumptions:
Core Assumptions of the PPF Model:
The model relies on four key simplifications that allow us to isolate fundamental economic relationships:
- The economy produces only two goods (in our example, oil and leather)
- Technology remains unchanged throughout the analysis
- The quantity of available resources stays constant
- All resources are used to their maximum capacity (full employment)
These assumptions create a simplified model that isolates key economic relationships. While real economies are more complex, the PPF provides valuable insights into opportunity cost, efficiency, and economic growth.
Constructing a simple PPF
We can build a PPF by first creating a production possibility schedule. This table shows different combinations of two goods that can be produced with available resources.
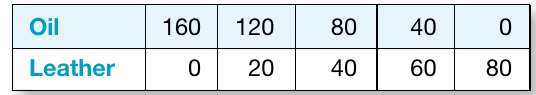
The schedule above shows five possible production combinations. At one extreme, all resources go toward oil production (160 units of oil, 0 leather). At the other extreme, all resources produce leather (0 oil, 80 units of leather). Between these extremes lie various combinations where resources are divided between both goods.
When we plot this data on a graph with oil on the vertical axis and leather on the horizontal axis, we create the production possibility frontier:
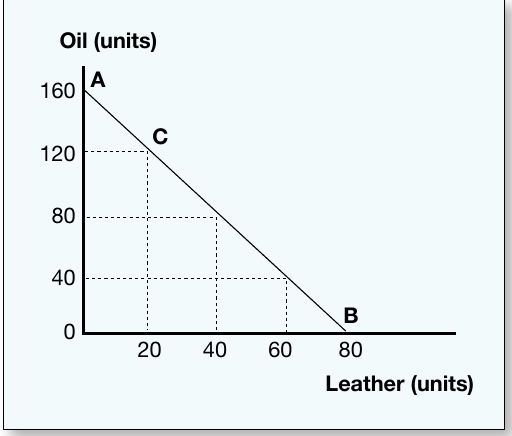
Points A and B represent the two extremes: specializing completely in oil or leather respectively. Point C represents a mixed production combination ( units of oil and units of leather). Any point along the frontier line represents an efficient production choice where all resources are fully employed.
Points on, inside, and outside the frontier
The position of production relative to the frontier reveals important information about resource utilization:
Points on the frontier indicate the economy is operating at maximum productive capacity. All available resources are fully employed and used efficiently. These points represent the best possible outcomes given current constraints.
Think of points on the PPF as the "production ceiling" - the economy cannot do better with its current resources and technology. Every point on the frontier represents an efficient allocation, though different points reflect different societal choices about which goods to prioritize.
Points inside the frontier show production below maximum capacity. When an economy operates at a point like A in the diagram below, it indicates unemployed or underemployed resources.
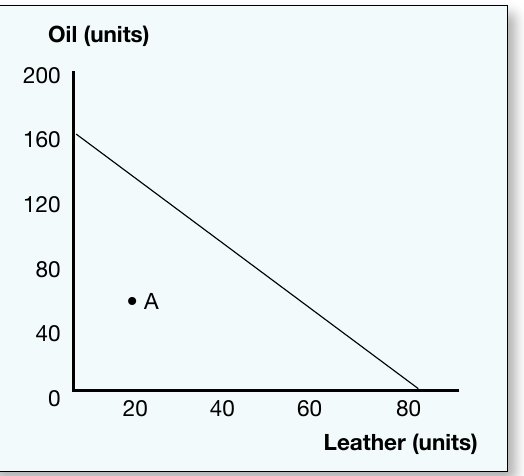
This situation represents an inefficient allocation of resources. The economy is not achieving maximum satisfaction of wants with minimum opportunity cost. Production is less than potential because some resources remain idle or are not used effectively. This could occur during an economic recession when factories close or workers cannot find employment.
Points outside the frontier are currently unattainable with existing resources and technology. An economy cannot produce beyond its PPF unless it acquires more resources or develops better technology.
Opportunity cost and the PPF
The PPF powerfully illustrates opportunity cost—the value of the next best alternative forgone when making a choice. Moving along the frontier from one production combination to another involves giving up some quantity of one good to gain more of another.
Understanding Movement Along the PPF:
Every movement along the production possibility frontier involves a trade-off. Because resources are fully employed at any point on the frontier, producing more of one good necessarily means producing less of another. This is the essence of opportunity cost in action.
Consider moving from combination A (160 units of oil, 0 leather) to combination B (120 units of oil, 20 units of leather):
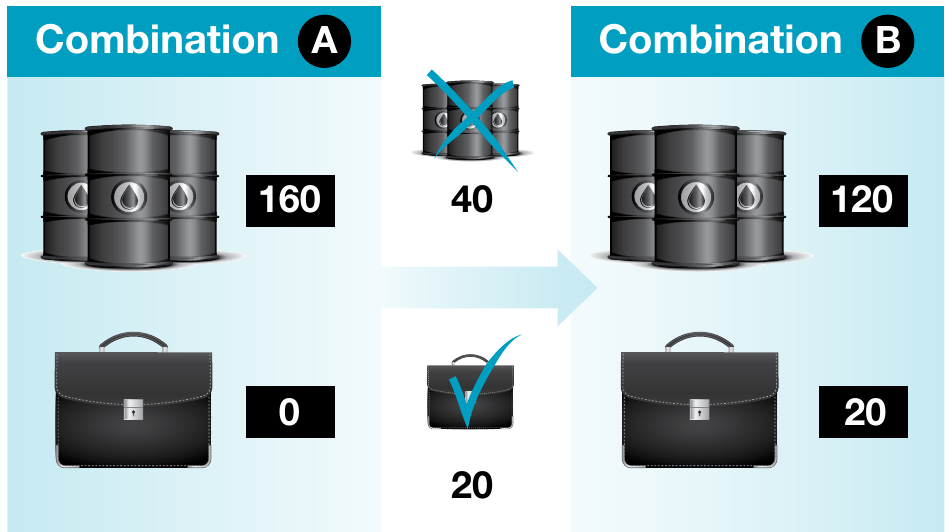
To acquire units of leather, we must sacrifice units of oil. Therefore, the opportunity cost of obtaining units of leather equals units of oil.
Worked Example: Calculating Opportunity Cost per Unit
Given information:
- Moving from combination A to combination B
- Oil sacrificed: units
- Leather gained: units
Step 1: Identify what is given up and what is gained
We give up units of oil to gain units of leather.
Step 2: Set up the opportunity cost calculation
Step 3: Substitute the values
Conclusion: For each additional unit of leather produced, society must forgo units of oil.
Understanding these trade-offs helps societies make informed decisions about resource allocation.
The steeper the PPF, the greater the opportunity cost of the good on the horizontal axis. A flatter PPF indicates a lower opportunity cost for that good. The slope of the PPF at any point represents the opportunity cost of choosing more of the horizontal-axis good.
Shifts in the production possibility frontier
The PPF is not fixed permanently. Several factors can shift the entire frontier outward, expanding an economy's productive capacity.
Technology improvements
When new technology is introduced, production becomes more efficient. Better technology allows an economy to produce more output using the same quantity of resources. This increases maximum production levels and shifts the PPF outward.
For example, if enhanced oil extraction methods are developed, the maximum possible oil production might increase from to units while using the same resources:
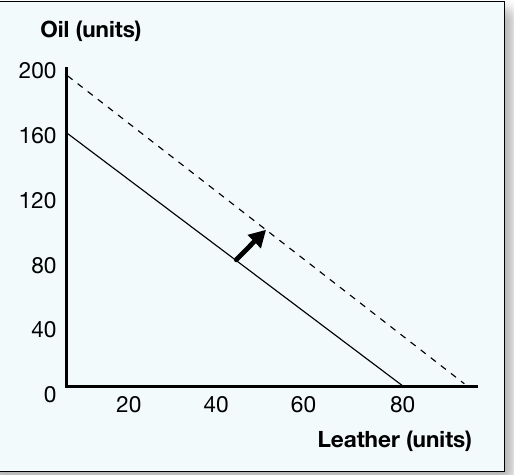
Asymmetric vs Symmetric Shifts:
Notice the frontier shifts outward, particularly along the oil axis. This asymmetric shift occurs because the technology improvement specifically affects oil production. If technology improved for both oil and leather production equally, the frontier would shift outward symmetrically - expanding equally along both axes.
Technology improvements represent genuine economic growth because they expand the economy's capacity to satisfy wants. The same resources now produce more output, increasing living standards without requiring additional inputs.
Discovery of new resources
Anything that increases the availability of production inputs will expand the PPF. This includes:
- Discovery of new natural resources (oil fields, mineral deposits)
- Population growth through immigration, increasing the labor force
- Investment in new capital equipment and machinery
- Expansion of agricultural land
When new resources become available, the economy can produce more of both goods. This pushes the entire production possibility frontier outward, similar to the technology improvement shown above. The frontier expands because the economy now has greater productive capacity.
For instance, if immigration increases the working-age population, more workers become available for both oil and leather production. This would shift the PPF outward along both axes, enabling higher production levels of both goods simultaneously.
The shape of the production possibility frontier
You may notice that PPF diagrams can be drawn as straight lines or curved lines. The shape depends on how opportunity costs change as we move along the frontier.
Why PPF Shape Matters:
The shape of the PPF reveals crucial information about how opportunity costs behave in the economy. This has significant implications for production decisions and resource allocation strategies. Understanding whether opportunity costs are constant or increasing helps predict how efficiently resources can be reallocated between different industries.
Linear PPF (constant opportunity cost)
The examples shown so far use straight-line PPFs. This shape indicates constant opportunity cost—the rate at which we can substitute one good for another remains unchanged. For a linear PPF, resources must be equally suited to producing both goods, allowing easy transfer between uses.
While straight-line PPFs simplify analysis and clearly demonstrate basic principles, they rarely reflect reality. Most resources have specific characteristics making them more productive in certain uses than others.
Concave PPF (increasing opportunity cost)
In the real world, PPFs typically curve inward (concave to the origin):
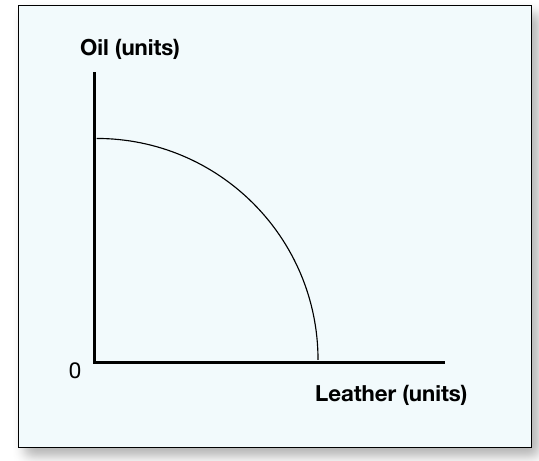
This shape reflects the principle of increasing opportunity cost. As we produce more and more of one good, each additional unit requires sacrificing increasingly larger amounts of the other good.
Why does this occur? Some resources are better suited to oil production while others work better for leather production. When we initially shift resources from oil to leather, we first move the resources most suitable for leather. These transfer easily with minimal loss in oil production.
However, as we continue producing more leather, we must eventually transfer resources that are highly specialized for oil production. These resources are less productive in leather manufacturing, so we sacrifice more oil for each additional unit of leather gained. The opportunity cost increases as we move down the curve.
The Principle of Resource Specialization:
The concave shape reflects a fundamental economic reality: resources are not perfectly interchangeable. A skilled oil engineer cannot instantly become an equally productive leather craftsperson. Oil drilling equipment cannot easily be converted into leather processing machinery. This specialization of resources causes opportunity costs to increase as production becomes more extreme.
The concave shape more accurately represents real economic choices. Resources are not perfectly interchangeable, so opportunity costs rise as production becomes more specialized.
Key Points to Remember:
- The production possibility frontier shows all possible combinations of two goods an economy can produce when using resources efficiently
- Points on the PPF represent full employment and productive efficiency; points inside indicate unemployment or inefficiency
- Opportunity cost is illustrated by movements along the PPF—gaining more of one good requires sacrificing some of another
- Outward shifts in the PPF result from technology improvements or increases in available resources
- Most PPFs are concave (bowed outward) because opportunity costs increase as production becomes more specialized