The Supply Curve (HSC SSCE Economics): Revision Notes
The Supply Curve
What is a supply curve?
The supply curve is a fundamental tool in economics that helps us understand the relationship between price and the quantity of goods that producers are willing to supply to the market. Before we can draw a supply curve, we need to understand the supply schedule.
The supply schedule
A supply schedule is a table that shows the quantity of a good that producers are willing and able to supply at different price levels during a specific time period. This table assumes that all other factors that might affect supply (such as production costs, technology, or the prices of other goods) remain constant – this is known as the ceteris paribus assumption.
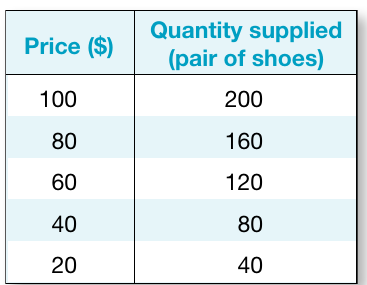
The table above shows a weekly market supply schedule for shoes. Notice how as the price increases from $20 to $100, the quantity supplied rises from 40 pairs to 200 pairs. This market supply schedule represents the combined supply from all firms operating in the shoe industry.
The ceteris paribus assumption (meaning "all other things being equal") is crucial in economics. It allows us to isolate the relationship between price and quantity supplied by assuming all other factors remain constant. In reality, many factors change simultaneously, but this assumption helps us understand each relationship clearly.
The law of supply
The supply schedule demonstrates the law of supply, which states that as the price of a product rises, the quantity supplied by producers will also rise. This positive relationship exists for two key reasons:
- Profitability for existing firms: When prices increase, firms already producing the good find it more profitable to make, so they increase their production levels.
- Attraction of new firms: Higher prices make production attractive to other businesses, encouraging new firms to enter the industry and add to the total quantity supplied.
Drawing the supply curve
The supply curve is simply the graphical representation of the supply schedule. We plot price on the vertical axis (y-axis) and quantity supplied on the horizontal axis (x-axis).
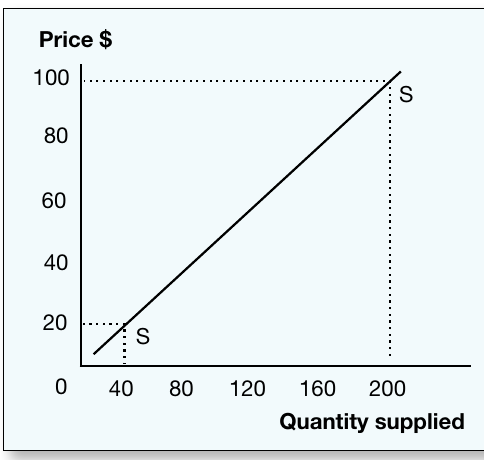
The typical supply curve slopes upward from left to right, visually showing the same positive relationship described in the law of supply. At a low price of $20, only 40 pairs of shoes are supplied, but at a high price of $100, suppliers are willing and able to put 200 pairs on the market. This upward slope is a defining characteristic of supply curves – more is supplied at higher prices, and less is supplied at lower prices.
Movements along the supply curve
When we analyze how supply responds to price changes, we must remember that we're holding all other factors constant (ceteris paribus). Changes in the price of the good itself cause movements along the existing supply curve, not shifts of the curve.
Expansion of supply
An expansion of supply occurs when an increase in price causes an increase in the quantity supplied. This is shown by an upward movement along the supply curve. When prices rise, producers are motivated to supply more of the good because it becomes more profitable to do so.
Contraction of supply
A contraction of supply occurs when a decrease in price causes a decrease in the quantity supplied. This is shown by a downward movement along the supply curve. When prices fall, producers find it less profitable and reduce the quantity they're willing to supply.
Understanding Movements Along the Supply Curve
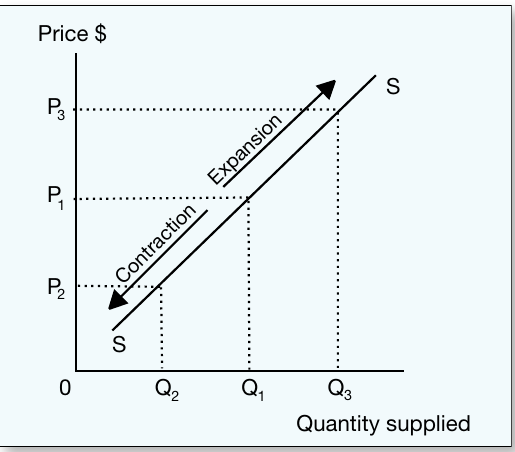
The diagram illustrates both types of movement clearly:
Contraction (price decrease): When price falls from P₁ to P₂, producers respond by reducing quantity supplied from Q₁ to Q₂. This movement down and to the left along the curve represents a contraction of supply.
Expansion (price increase): When price rises from P₁ to P₃, producers respond by increasing quantity supplied from Q₁ to Q₃. This movement up and to the right along the curve represents an expansion of supply.
Notice that in both cases, we're moving along the same supply curve – the curve itself hasn't shifted position.
Critical Point: Only changes in the price of the good itself cause movements along the supply curve. All other factors cause shifts of the entire curve, which we examine next. This distinction is essential for correct economic analysis.
Shifts of the supply curve
While price changes cause movements along a supply curve, other factors can cause the entire supply curve to shift to a new position. These shifts represent changes in the underlying conditions of production and are called increases or decreases in supply.
Increase in supply
An increase in supply occurs when the entire supply curve shifts to the right. This means that at every price level, producers are now willing and able to supply more of the good than before.
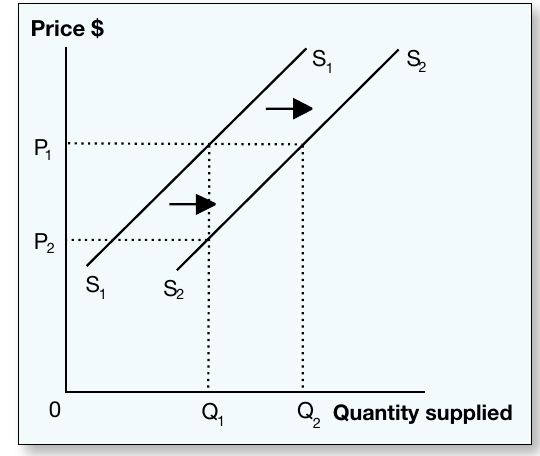
When the supply curve shifts from S₁ to S₂, we can observe two important changes:
- More quantity at the same price: At price P₁, firms originally supplied quantity Q₁. After the increase in supply, they now supply the larger quantity Q₂ at that same price.
- Same quantity at a lower price: Originally, firms would only supply quantity Q₁ at price P₁. After the increase, they're willing to supply that same quantity Q₁ at the lower price P₂.
Both observations describe the same rightward shift – they're just two different ways of looking at it. This is important to remember: when analyzing a supply increase, you can describe it either way, and both are correct!
Decrease in supply
A decrease in supply occurs when the entire supply curve shifts to the left. This means that at every price level, producers are now willing and able to supply less of the good than before.
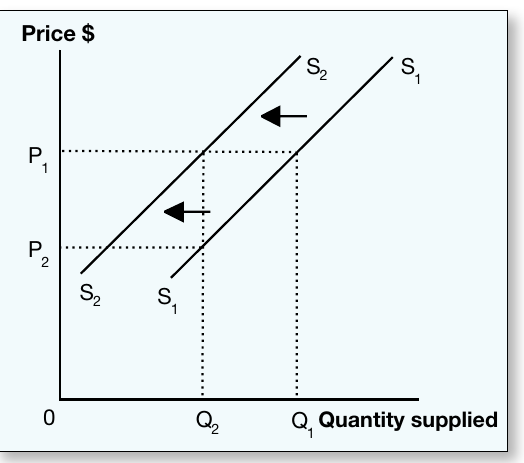
When the supply curve shifts from S₁ to S₂, we observe:
- Less quantity at the same price: At price P₁, firms originally supplied quantity Q₁. After the decrease in supply, they now supply only the smaller quantity Q₂ at that same price.
- Same quantity at a higher price: Originally, firms supplied quantity Q₂ at the lower price P₂. After the decrease, they'll only supply that same quantity Q₂ at the higher price P₁.
Factors causing supply curve shifts
Numerous non-price factors can cause supply curves to shift. Understanding these is crucial for analyzing real-world markets.
Factors that increase supply (shift right):
- Fall in production costs: Lower costs for labor, capital, or raw materials make production more profitable at every price level, encouraging firms to supply more.
- Technological improvements: Better production technology increases efficiency, allowing firms to produce more at the same cost.
- Prices of other goods fall: If a firm can produce multiple products, a fall in the price of alternative products makes the current good relatively more attractive to produce.
- Increased resource availability: More factors of production (land, labor, capital) become available for use in production.
- Favorable conditions: Better weather, seasonal changes, or other environmental factors that make production easier or more efficient.
Factors that decrease supply (shift left):
- Rise in production costs: Higher costs for factors of production make it less profitable to supply goods at current prices.
- Prices of other goods rise: If alternative products become more profitable, firms may shift production away from the current good.
- Decreased resource availability: Fewer resources available for production reduces the quantity that can be supplied.
- Government regulations: Restrictions on sales due to health and safety concerns (such as fireworks regulations) reduce supply.
- Unfavorable conditions: Poor weather, seasonal changes, or other factors that make production more difficult or costly.
Real-World Application: Coffee Supply Shifts
Consider the global coffee market. Several factors could shift the supply curve:
Rightward shift (increase in supply):
- A breakthrough in coffee plant genetics creates a more disease-resistant variety, allowing farmers to produce more coffee at the same cost
- Coffee-producing countries invest in modern harvesting equipment, reducing production costs
- The price of tea (an alternative crop for some farmers) falls significantly, making coffee relatively more attractive to produce
Leftward shift (decrease in supply):
- An unexpected frost damages coffee crops in Brazil, the world's largest producer
- Rising minimum wages in coffee-producing countries increase labor costs
- New environmental regulations require more expensive sustainable farming practices
In each case, notice that the shift occurs due to factors other than the price of coffee itself.
Key distinctions for exam success
Understanding the difference between movements along the supply curve and shifts of the supply curve is essential:
- Movements along (expansions and contractions) are caused solely by changes in the product's own price
- Shifts (increases and decreases) are caused by all other factors affecting supply
When analyzing a market scenario, always ask: "Is this a price change of the good itself, or a change in some other factor?" This will tell you whether to show a movement along the curve or a shift of the curve.
Common Exam Mistake to Avoid
Students often confuse movements along the supply curve with shifts of the supply curve. Remember:
- If the price of the good changes → movement along the curve (expansion or contraction)
- If anything else changes → shift of the entire curve (increase or decrease)
Always identify what has changed in the question before deciding whether to show a movement or a shift. This distinction is frequently tested and getting it wrong will cost you marks!
Key Points to Remember:
-
The supply curve slopes upward from left to right, showing the positive relationship between price and quantity supplied as described by the law of supply.
-
Movements along the supply curve occur when price changes: expansions (price rises, moving up the curve) and contractions (price falls, moving down the curve).
-
Shifts of the supply curve occur when non-price factors change: increases in supply (rightward shift) mean more supplied at each price; decreases in supply (leftward shift) mean less supplied at each price.
-
Only price changes of the good itself cause movements along the curve – everything else causes shifts of the entire curve.
-
Key factors causing shifts include production costs, technology, prices of other goods, resource availability, and external conditions like weather or government regulations.