Statistical Investigation (HSC SSCE Mathematics Standard): Revision Notes
Statistical Investigation
What is a statistical investigation?
A statistical investigation is a systematic process used to collect and analyze data to answer questions or solve problems. The insights gained from statistical investigations play a vital role in our society, helping us make informed decisions in areas like health, education, business, and government policy.
Every statistical investigation follows four key steps to ensure the process is thorough and the conclusions are reliable.
The four steps of a statistical investigation
Step 1: Collect the data
Data collection is the foundation of any statistical investigation. This step involves three important tasks:
- Deciding exactly what information you need
- Identifying where to find this information
- Gathering the data systematically
There are two main approaches to collecting data:
Census: Data is gathered from every member of the entire population. For example, a national census counts every person in a country. While this gives complete information, it can be time-consuming and expensive.
Survey: Data is collected from a smaller group (sample) within the population. For example, surveying students from a school of students. This is faster and more cost-effective than a census.
Why data quality matters
The quality of your data determines the quality of your conclusions. You must ensure that data collection procedures guarantee:
- Accuracy: The data correctly represents what it claims to measure
- Currency: The information is up-to-date and relevant to the current situation
- Relevance: The data collected actually relates to your investigation question
- Security: Personal or sensitive information is protected appropriately
Avoiding bias
When using a survey, the sample must be representative of the entire population. If your sample is biased, your conclusions will be unreliable.
For instance, if you wanted to know the favourite sport of all students in your school, but only surveyed students in sports classes, your results would be biased toward athletic activities.
Step 2: Organise the data
Once collected, raw data needs structure to be useful. Organising data involves arranging, representing, and formatting the information in a logical way.
The method of organisation depends on your investigation's purpose. For example:
- If you need to store and search large amounts of data, you might categorise it into groups
- If you're comparing two variables, you might arrange data in a two-column table
- If you're tracking changes over time, you might order data chronologically
Organisation gives structure to your data, making it easier to work with in the next steps.
Step 3: Summarise and display the data

This step transforms organised data into formats that are easy to understand and communicate. Information should be well-organised, readable, attractively presented, and accessible to your audience.
Displaying data visually
Data is commonly displayed using various types of graphs:
- Scatterplots: Show relationships between two numerical variables
- Dot plots: Display individual data points along a number line
- Histograms: Show the frequency distribution of data
- Line graphs: Illustrate trends over time
- Stem-and-leaf plots: Organize numerical data while preserving individual values
- Box plots: Display the spread and center of data distribution
Summarising data numerically
Data can also be summarised using statistical measures:
- Mean: The average value
- Median: The middle value when data is ordered
- Mode: The most frequently occurring value
- Standard deviation: Measures how spread out the data values are
These visual and numerical summaries make patterns and trends much easier to identify than looking at raw data alone.
Step 4: Analyse the data
Analysis is the process of interpreting your data and transforming it into meaningful information. This involves examining the data carefully and drawing conclusions based on what you observe.
Analyzing bivariate data
When investigating the relationship between two variables (bivariate data), you need to determine:
- Form: Is the relationship linear, curved, or another pattern?
- Direction: Is it positive (both variables increase together) or negative (one increases as the other decreases)?
- Strength: How closely do the data points follow the pattern?
Tools for analysis
Scatterplots and lines of best fit are essential tools for analyzing bivariate data. They allow you to:
- Make instant visual comparisons
- Identify trends and patterns
- Make predictions about values within the data range (interpolation)
- Make predictions beyond the data range (extrapolation)
Worked example: Case study of a statistical investigation
Worked Example: Investigating Blood Glucose and Weight
Let's see how all four steps work together in practice. James was asked to investigate whether an adult's blood glucose level (measured in ) can be predicted from their weight (in kilograms).
Step 1: Collecting the data
James accessed medical records for adults, obtaining both their weight and blood glucose measurements.
Step 2: Organising the data
James categorised the information into two variables: blood glucose levels and weight.
Step 3: Summarising and displaying the data
James created a table to organise the data:
| Weight | Glucose | Weight | Glucose |
|---|---|---|---|
He then created a scatterplot to visualize the relationship:
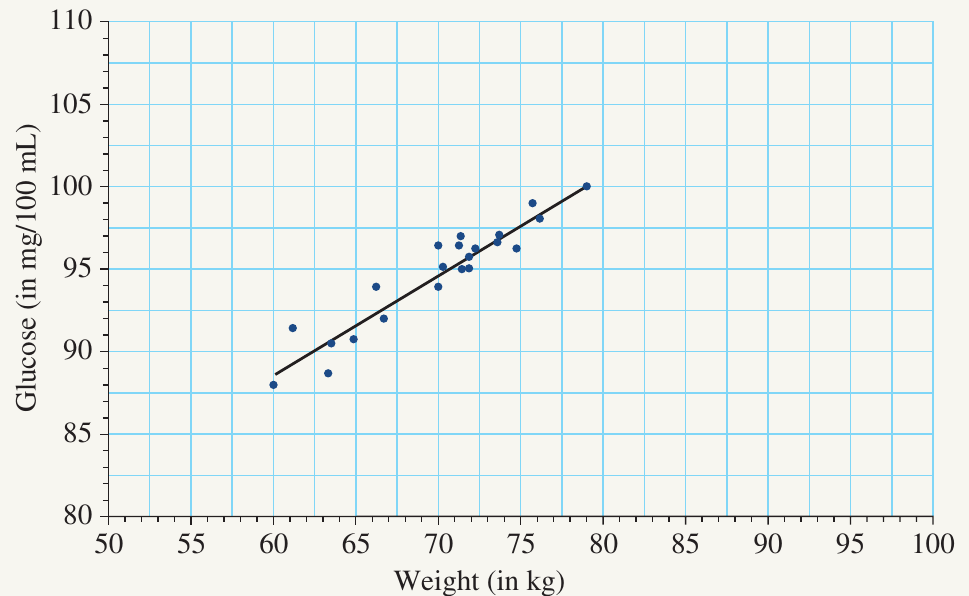
Step 4: Analysing the data
James performed several calculations to analyze the relationship:
a) Measuring the strength of association
James calculated Pearson's correlation coefficient:
This value close to indicates a strong positive linear association between weight and blood glucose levels.
b) Finding the regression line
James calculated the equation for the least-squares regression line:
Using the form :
In context:
c) Making predictions
James used his regression equation to predict the glucose level for a person weighing kg:
Therefore, a person weighing kg is predicted to have a blood glucose level of approximately mg/100mL.
Issues in statistical investigations
Statistical investigations raise important ethical considerations. Being aware of these issues helps ensure your investigation is conducted responsibly and your conclusions are trustworthy.
Bias
Bias occurs when data is unfairly skewed or gives too much weight to a particular result. Biased data leads to unreliable conclusions.
For example, imagine surveying people about their favourite music genre, but only asking teenagers. If you then claimed your results represent the entire population's preferences, your investigation would be biased. The teenage sample doesn't represent all age groups fairly.
To minimize bias:
- Use random sampling methods when possible
- Ensure your sample represents all relevant groups in the population
- Be aware of your own assumptions that might influence data collection
- Use multiple checks to identify potential bias
Accuracy
The accuracy of collected data is crucial for reliable conclusions. Accuracy depends on:
- The reliability of your data sources
- Whether data has been recorded correctly
- How measurements were taken
Checking accuracy can be time-consuming and difficult. Often, you need to compare data from multiple sources to determine which information is most reliable. Always question where data comes from and how it was collected.
Copyright
Copyright is the legal right to use, copy, or control creative works and data produced by authors and researchers.
Key points about copyright:
- It is illegal to infringe copyright by using others' work without permission
- Data found on the internet is usually protected by copyright
- You must cite sources and obtain permission when required
- Plagiarism (copying without attribution) is both unethical and often illegal
When conducting statistical investigations, always properly acknowledge your data sources and respect intellectual property rights.
Privacy
Privacy is an individual's ability to control their personal information and how it is used.
Important privacy considerations:
- Data collected about individuals isn't always accurate due to:
- Mistakes in gathering or entering information
- Mismatches between data and the person it represents
- Out-of-date information
- People often share information with specific parties while expecting it to remain confidential
- Just because someone shares information with person A doesn't mean they consent to person A sharing it with person B
When handling personal data, you must protect individuals' privacy, use data only for stated purposes, and maintain confidentiality.
Causation versus correlation

Causation indicates that one event is the direct result of another event or variable occurring. This is often called a cause-and-effect relationship—one event causes another event to happen.
For example, a school bell ringing at the end of a period causes students to leave for their next class. The bell is the cause, and students leaving is the effect.
The correlation-causation warning
Correlation does not imply causation
When conducting statistical investigations, it's crucial to understand that just because two variables have a strong correlation doesn't mean one causes the other.
Example: The increase in mobile phone usage shows a strong positive correlation with increased life expectancy over recent decades. Both have increased together, so they're correlated. However, using mobile phones does not cause people to live longer. These two trends happen to occur during the same time period but are not causally related.
When you find strong correlations in your data:
- Don't automatically assume one variable causes changes in the other
- Look for other explanations (like a third variable affecting both)
- Consider whether the relationship makes logical sense
- Remember that coincidental correlations are common, especially with large datasets
Understanding the difference between correlation and causation is essential for drawing valid conclusions from statistical investigations.
Remember!
Key Points to Remember:
-
A statistical investigation follows four steps: collect, organise, summarise and display, and analyse data. Use the acronym COSA to remember these steps.
-
The quality of your data collection determines the quality of your conclusions. Always ensure data is accurate, current, relevant, and representative of the population.
-
Be aware of ethical issues: bias, accuracy, copyright, and privacy must all be considered when conducting statistical investigations. Remember BACP (Bias, Accuracy, Copyright, Privacy).
-
Use appropriate visual displays (scatterplots, histograms, box plots) and summary statistics (mean, median, standard deviation) to make data understandable.
-
Correlation does not equal causation—two variables can be strongly related statistically without one causing the other. Always think critically about cause-and-effect claims.