Quadratic Functions and Models (HSC SSCE Mathematics Standard): Revision Notes
Quadratic Functions and Models
What is a quadratic function?
A quadratic function is a special type of mathematical curve that contains an squared term (). When you graph a quadratic function, you get a U-shaped curve called a parabola.
The general form of a quadratic function is:
where , , and are numbers (called coefficients and constants).
Quadratic functions are graphed similarly to exponential functions, but the points are joined to create a smooth parabolic curve rather than an exponential curve. This smooth, continuous curve is what gives the parabola its distinctive U-shape.
Key features of a parabola
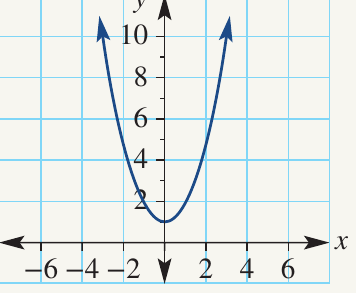
The basic parabola
The simplest parabola has the equation . Understanding this basic form helps you recognise how other parabolas behave.
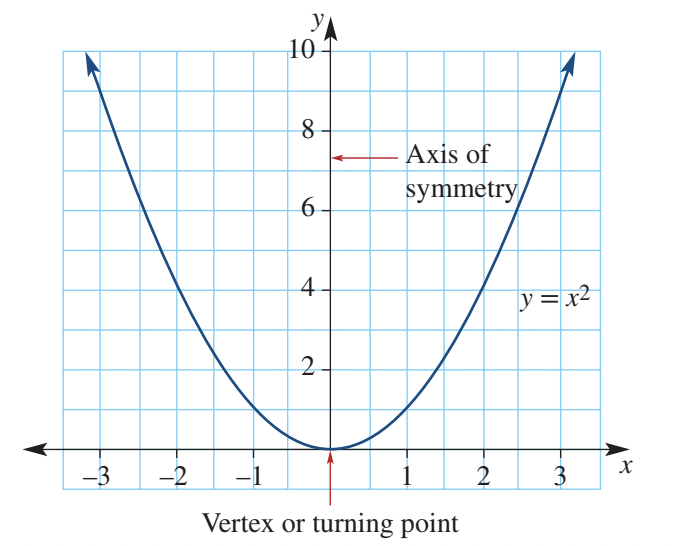
For the basic parabola :
- The vertex (or turning point) is located at
- It is a minimum turning point (the lowest point on the curve)
- The axis of symmetry is the line (which is the y-axis)
- Both the y-intercept and x-intercept are at
- The parabola is symmetric - if you fold it along the axis of symmetry, both sides match perfectly
Minimum and maximum turning points
Parabolas can open upward or downward, creating two different types of turning points.
Minimum turning point (parabola opens upward):
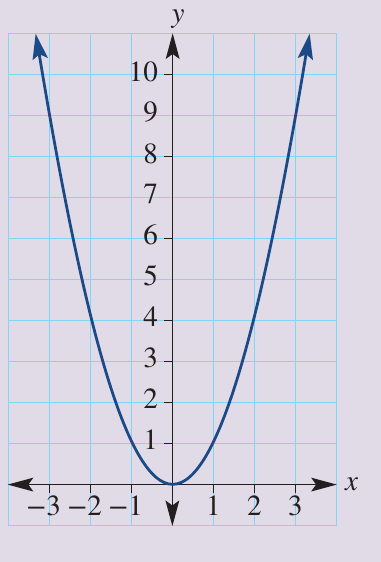
When is positive in , the parabola opens upward like a smile. The vertex is the lowest point, making it a minimum turning point.
Maximum turning point (parabola opens downward):
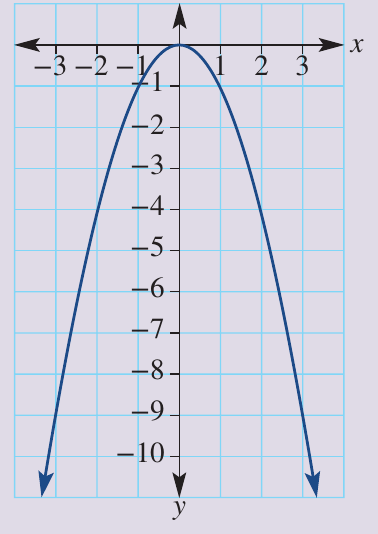
When is negative (like in ), the parabola opens downward like a frown. The vertex is the highest point, making it a maximum turning point.
Remember the sign of :
- Positive → parabola opens upward (smiles) → minimum turning point
- Negative → parabola opens downward (frowns) → maximum turning point
The graph is the reflection of about the x-axis (flipped upside down).
How changing the equation affects the parabola
Understanding how different parts of the equation affect the parabola's shape and position is crucial for graphing and analysis.
Changing the coefficient of :
- Equations like or change the height and width of the parabola
- A larger coefficient makes the parabola narrower (steeper sides)
- A smaller coefficient makes the parabola wider (gentler sides)
Adding or subtracting a constant:
- Equations like or shift the parabola vertically
- The shape stays the same, but the position changes
- Adding a positive number moves the parabola up
- Subtracting (or adding a negative number) moves the parabola down
Graphing a parabola
To draw an accurate parabola, follow these four systematic steps:
Four-Step Graphing Process:
- Construct a table of values - Choose x-values and calculate corresponding y-values
- Draw a number plane - Set up your coordinate axes with appropriate scales
- Plot the points - Mark each coordinate pair on your graph
- Join the points to make a parabola - Draw a smooth curve through all the points
Worked example: Graphing
Worked Example: Graphing
Let's graph the function step by step.
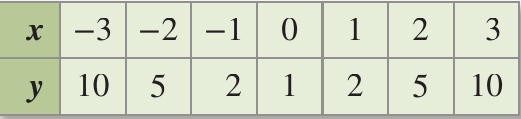
Step 1: Construct a table of values
Choose x-values:
Substitute each x-value into the equation:
- When :
- When :
- When :
- When :
- When :
- When :
- When :
Step 2: Draw a number plane
Set up a coordinate system with x on the horizontal axis and y on the vertical axis. Make sure your scale accommodates all the points.
Step 3: Plot the points
Mark these coordinates: , , , , , ,
Step 4: Join the points
Draw a smooth, curved line through all the points to create the parabola.
Determining features of a parabola
Once you've drawn a parabola, you can identify several important features. Let's work through a complete example.
Worked example: Features of
Worked Example: Finding Features of
Draw the graph using x-values:
Creating the table of values:
Calculate y for each x-value:
- When :
- When :
- When :
- When :
- When :
- When :
- When :
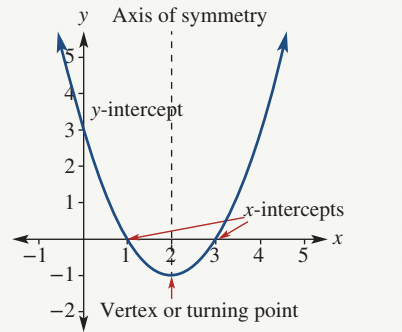
After plotting and joining these points, we can identify the key features:
a) Turning point: This is where the parabola changes direction. For this graph, the turning point is (2, -1).
b) Axis of symmetry: This is the vertical line that divides the parabola into two mirror images. The axis of symmetry is x = 2.
c) y-intercept: This is where the parabola crosses the y-axis. The y-intercept is 3 (at point ).
d) x-intercepts: These are where the parabola crosses the x-axis. The x-intercepts are 1 and 3 (at points and ).
e) Minimum value: This is the smallest y-value on the graph. The minimum value is -1 (occurring at the turning point).
Quadratic models
A quadratic model uses a quadratic function to describe a real-world situation. These models appear in many practical contexts, such as:
- Calculating areas of shapes
- Predicting projectile motion (like thrown balls or rockets)
- Modelling business profit and loss
- Describing population growth patterns
The mathematical form is the same as any quadratic function:
where the variables represent real quantities (like area, time, distance, or cost).
Worked example: Garden area problem
Worked Example: Garden Area Problem
A rectangular garden has length metres. The area (in square metres) is given by the formula:
Let's answer several questions about this garden using a graph.
Creating the graph:
Calculate area values for lengths from to metres:
Plot these points and join them to form a parabola:
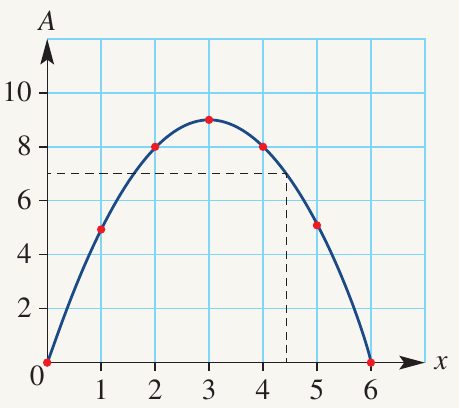
Using the graph to answer questions:
Question a): What is the area when the length is 4.5 m?
Draw a vertical line from up to the curve, then draw a horizontal line to the A-axis.
Reading from the graph: approximately 7 m²
Checking algebraically:
Question b): What is the maximum area?
Look for the highest point on the parabola. The maximum area is 9 m².
Question c): What garden length gives the maximum area?
Find the x-value at the highest point. Maximum area occurs when x = 3 metres.
Exam tip: When reading values from a graph, always draw construction lines (vertical and horizontal) to help you read accurately. If possible, verify your answer using the equation to ensure your graphical reading is correct.
Remember!
Key Points to Remember:
- A quadratic function has the form and creates a U-shaped curve called a parabola
- Parabolas can open upward (minimum turning point) or downward (maximum turning point) depending on whether is positive or negative
- Key features include: vertex (turning point), axis of symmetry, x-intercepts, and y-intercept
- To graph a parabola: create a table of values, draw a coordinate plane, plot points, and join with a smooth curve
- Quadratic models apply quadratic functions to real-world situations like area calculations, helping us find maximum or minimum values in practical contexts