Network Problems (HSC SSCE Mathematics Standard): Revision Notes
Network Problems
Network problems involve representing real-world situations as network diagrams, where we use dots and lines to show relationships and connections. These diagrams help us visualise and analyse complex systems in a simplified way.
Network diagrams are powerful tools used in many fields including transport planning, computer networks, social networks, and project management. By converting complex real-world situations into simple diagrams, we can more easily identify patterns, connections, and potential problems.
Understanding network diagrams
A network diagram is a visual representation that uses two main components:
Vertices are the dots or nodes in a network diagram. They represent key points, locations, or objects in the situation you're modelling. For example, in a transport network, each city would be a vertex.
Edges are the lines connecting vertices. They represent direct connections, routes, or relationships between the vertices. In a transport network, an edge would show a direct route between two cities.
When creating network diagrams, remember that:
- The physical distances between vertices don't need to match real-life distances
- The exact positioning of vertices is flexible
- What matters is showing which vertices are connected, not their precise locations
This flexibility makes network diagrams much simpler to draw than scaled maps!
Drawing network diagrams from maps
Let's look at how to convert a geographical map into a network diagram. The key is to focus on connections rather than accurate distances or positions.
Worked Example: Australian Highway Network
Consider the main highways connecting Australia's capital cities. We'll create a network diagram to represent these connections.
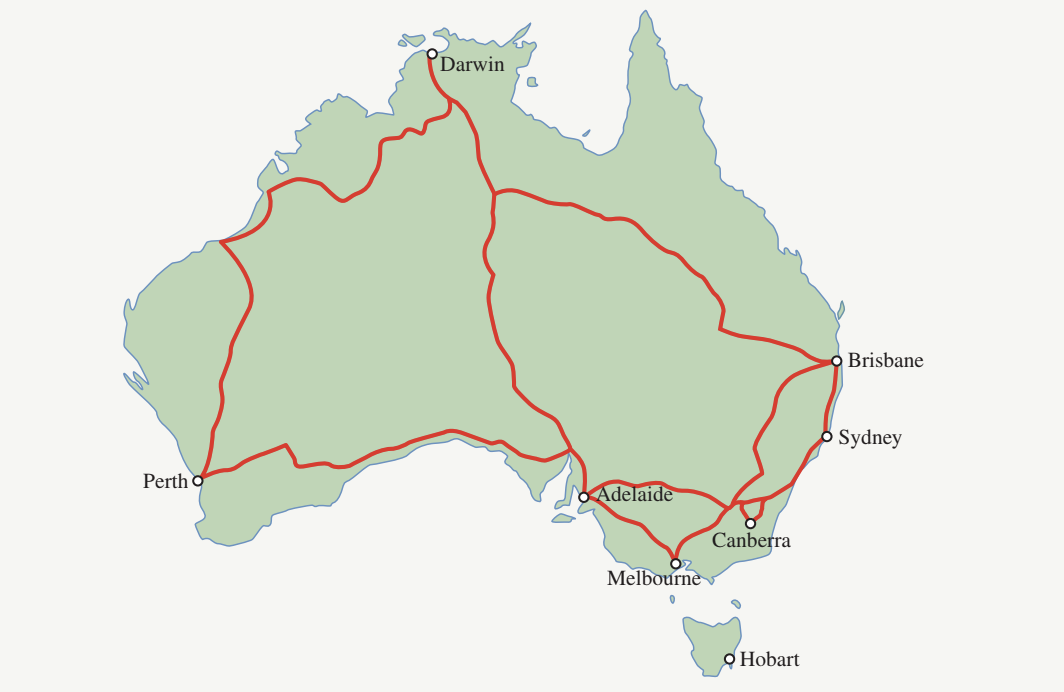
Steps to construct the network diagram:
Step 1: Identify what will be your vertices
- In this case, each capital city becomes a vertex
- The vertices are: Darwin, Brisbane, Sydney, Canberra, Melbourne, Hobart, Adelaide, and Perth
Step 2: Determine what connections will be your edges
- Highway routes between cities will be represented as edges
- Draw an edge only where there is a direct highway connection
Step 3: Draw a dot for each vertex
- Start by placing dots on your page
- Space them out so the diagram won't be too crowded
Step 4: Label each vertex clearly
- Write the name of each capital city next to its corresponding dot
Step 5: Connect the vertices with edges
- Draw a line between two vertices if there is a highway route connecting those cities
- Note that Hobart has no highway connection to any other capital city
The resulting network diagram:
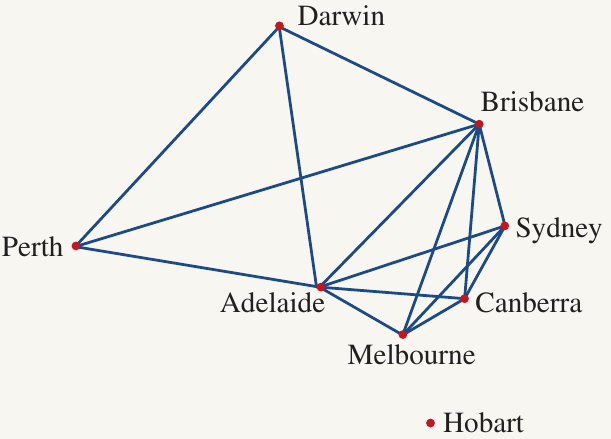
Connected vs disconnected networks
This example demonstrates an important concept: disconnected networks.
A connected network is one where you can travel from any vertex to any other vertex by following edges. In other words, there's a path linking every vertex to every other vertex.
A disconnected network is one where at least one vertex cannot be reached from the others. In our Australian highways example, Hobart cannot be reached from the other cities because it has no edges connecting it to the rest of the network.
The Hobart example makes sense in reality because Hobart is on the island of Tasmania, separated from mainland Australia by water. This demonstrates how network diagrams can accurately represent real-world limitations - in this case, the geographical barrier that prevents a direct highway connection.
Drawing network diagrams from tables
Network diagrams can also represent relationships shown in tables or data sets. This is particularly useful for representing social connections, partnerships, or collaborative relationships.
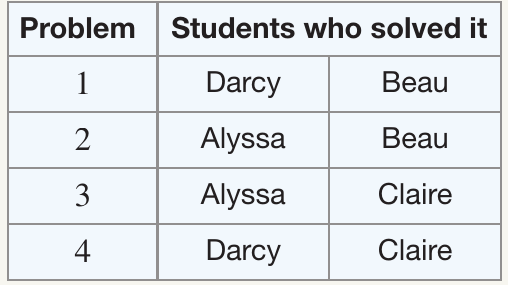
Worked Example: Student Problem-Solving Pairs
Four students worked in pairs to solve four different problems. Here's the data:

Let's answer several questions about this situation:
Question a: What will be the vertices of the network diagram?
Solution:
- The vertices represent the students
- Therefore, the vertices are: Alyssa, Beau, Claire, and Darcy
Question b: What will an edge represent in the network diagram?
Solution:
- An edge connects two students who have worked together to solve at least one problem
- If two students appear together in the table, they are connected by an edge
Question c: Draw a network diagram to represent the information in the table.
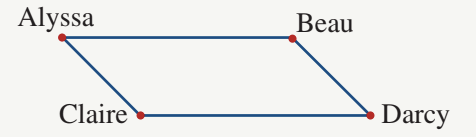
Solution:
Step 1: Draw four dots representing the four students
Step 2: Label each vertex with a student's name
Step 3: Examine the table to determine connections:
- Darcy and Beau solved problem together → draw an edge between them
- Alyssa and Beau solved problem together → draw an edge between them
- Alyssa and Claire solved problem together → draw an edge between them
- Darcy and Claire solved problem together → draw an edge between them
Step 4: The completed network diagram shows all partnerships
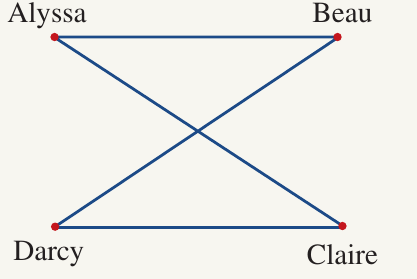
Note that this network is connected because you can travel from any student to any other student by following edges. For example, to go from Alyssa to Darcy, you could go via Beau or via Claire.
Question d: Draw an isomorphic graph of the network diagram.
Solution:
Isomorphic graphs are different-looking diagrams that represent exactly the same network. They must have:
- The same number of vertices
- The same number of edges
- The same connections between vertices
The vertices can be arranged differently in space, but the pattern of connections must remain identical.
In the diagrams above, both graphs show the same network, just with the vertices positioned differently. Alyssa connects to Beau and Claire in both diagrams. Darcy connects to Beau and Claire in both diagrams. The structure is identical even though the layout appears different.
Question e: Which students have not been able to solve a problem together?
Solution:
To find students who haven't worked together, look for pairs of vertices that are not connected by an edge:
- Alyssa and Darcy have no edge between them
- Beau and Claire have no edge between them
Therefore, these are the pairs who have not solved a problem together.
Understanding Isomorphic Graphs
Think of isomorphic graphs like the same person in different poses - the structure remains the same even though the appearance changes. When checking if two graphs are isomorphic:
- Count the vertices - must be equal
- Count the edges - must be equal
- Check each vertex's connections - must match in both graphs
If you rearrange the vertices but maintain all the same connections, you've created an isomorphic graph!
Exam tips
Strategies for Network Problems
When working with network problems:
- Check your edges carefully - Make sure you've drawn an edge for every connection mentioned in the question, and haven't added any extra edges
- Connected vs disconnected - A network is only connected if you can reach every vertex from every other vertex by following edges
- Isomorphic graphs - When drawing an isomorphic graph, count the connections for each vertex and ensure they match in your new diagram
- Layout doesn't matter - Your network diagram doesn't need to look like the map or table. Focus on showing the connections correctly, not on making it look similar to the original
Key Points to Remember:
- Vertices are dots representing key points or objects (cities, people, etc.)
- Edges are lines showing direct connections or relationships between vertices
- A connected network allows you to travel from any vertex to any other vertex by following edges
- A disconnected network has at least one vertex that cannot be reached from the others
- Isomorphic graphs have the same structure but different layouts - same vertices, same edges, same connections, just arranged differently
- Network diagrams are simplified representations - distances and positions don't need to be proportional to reality
- When converting maps or tables to networks, focus on identifying connections rather than preserving physical layout