Speed as a Rate and Distance–Time Graphs (HSC SSCE Mathematics Standard): Revision Notes
Speed as a Rate and Distance–Time Graphs
What is speed?
Speed tells us how quickly something moves. It's a special type of rate that compares the distance travelled to the time taken to travel that distance. When we measure speed, we're essentially asking "how far does something go in a certain amount of time?"
In Australia, speed is typically measured in kilometres per hour (km/h). This unit tells us how many kilometres an object travels in one hour of driving. For example, if a car travels at 60 km/h, it means the car covers 60 kilometres in one hour of driving.
Understanding speed as a rate is fundamental to physics. Just like other rates (such as price per kilogram or litres per minute), speed compares two quantities: the distance covered and the time it takes to cover that distance.
Measuring speed
There are several devices that help us measure and track speed:
Speedometer: This instrument in your car dashboard shows your instantaneous speed – that's the speed you're travelling at that exact moment. While speedometers are quite accurate, they typically have a tolerance of about 5%, meaning they might be slightly off the true speed.
Odometer: Also found in cars, an odometer displays the total distance a vehicle has travelled since it was manufactured or since the last reset.
GPS devices: Modern GPS technology can show very precise speed readings by calculating the distance travelled over very short time intervals (one-hertz intervals).
Speed formulas
There are three related formulas we use when working with speed, distance, and time. These formulas help us calculate any one of these quantities if we know the other two.
The three formulas
This formula calculates speed when we know distance and time.
This formula calculates time when we know distance and speed.
This formula calculates distance when we know speed and time.
Where:
- = Distance
- = Speed
- = Time
The DST triangle
A helpful way to remember these formulas is using the DST triangle. This memory aid shows the relationship between Distance, Speed, and Time.

How to use the DST triangle:
To use the triangle: cover up the quantity you want to find, and the triangle shows you the formula to use. For example, if you cover S (speed), you're left with D over T, giving you . This simple technique helps you quickly recall the correct formula during problem-solving.
Calculating speed and time
Let's look at how to apply these formulas to solve practical problems.
Worked Example: Finding Average Speed
Question: Find the average speed of a car that travels 341 km in 5 hours.
Solution:
Write the formula:
Substitute the values ( and ):
Calculate:
Answer: The car's average speed is 68.2 km/h.
Worked Example: Finding Time Taken
Question: How long will it take a vehicle to travel 294 km at a speed of 56 km/h?
Solution:
Write the formula:
Substitute the values ( and ):
Calculate:
Converting to hours and minutes:
Answer: The journey will take 5 hours and 15 minutes.
When solving speed problems, always remember to:
- Write the formula first
- Identify which values you have and which you need to find
- Substitute carefully, checking your units
- Show all working steps
- State your final answer with the correct units
Understanding distance–time graphs
Distance-time graphs are visual tools that tell the story of a journey. They show us how far an object has travelled at different points in time, making it easy to see the pattern of movement throughout a trip.
Key features of distance–time graphs
Distance-time graphs are line graphs where:
- The horizontal axis (x-axis) represents time
- The vertical axis (y-axis) represents distance from the starting point
Each section of the journey appears as a line segment on the graph. Different events during the journey create different types of lines, and by reading these lines, we can understand what happened during each part of the trip.
What the gradient tells us
The gradient (or slope) of a line on a distance-time graph is very important because it represents speed. Here's how to calculate it:
The gradient of a distance-time graph equals speed
This is one of the most important concepts to understand:
- A steeper line indicates the object is travelling faster
- A gentler slope indicates the object is travelling slower
- A horizontal line (flat) indicates the object is stationary (not moving at all)
Remember: Steeper is faster!
When you see different sections with different steepness on a distance-time graph, it shows that the speed changed during different parts of the journey.
Reading and interpreting distance–time graphs
Let's work through a detailed example to practice reading distance-time graphs.
Worked Example: Analysing a Car Trip
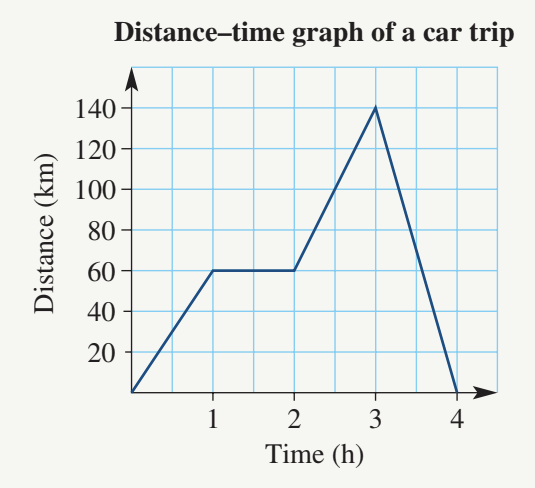
Question: The distance-time graph below shows a car trip taken last Sunday.
a) How long was the rest stop?
b) How far did the car travel from its starting point?
c) What was the total distance travelled?
d) Determine the average speed during the first hour of the trip.
Solution:
a) Finding the rest stop duration
A rest stop appears as a horizontal line on the graph because the distance isn't changing – the car is stationary. Looking at the graph, we can see a horizontal section between hour 2 and hour 3.
Answer: Time for rest stop = 1 hour
b) Maximum distance from starting point
The furthest point from the start is shown by the highest point on the graph. Looking at the vertical axis, the maximum distance reached is:
Answer: Distance = 140 km
c) Total distance travelled
This is a bit tricky! The car travelled 140 km away from the starting point, then returned home (shown by the line coming back down to zero). So the total distance includes both the outward and return journeys:
Answer: Total distance = 280 km
d) Average speed in the first hour
During the first hour, the car travelled from 0 km to 60 km. We can use the speed formula:
Answer: The average speed during the first hour was 60 km/h.
Common mistake to avoid:
In part (c), students often give the answer as 140 km, forgetting that the car made a return journey. Always check if the graph shows the object returning to its starting point – if the line comes back down to zero, you need to count both the outward and return distances!
Key Points to Remember:
-
Speed is a rate that compares distance travelled to time taken, typically measured in km/h.
-
Three formulas connect speed, distance, and time: , , and . Use the DST triangle to remember them.
-
Distance-time graphs show journeys visually with time on the horizontal axis and distance on the vertical axis.
-
Gradient equals speed: The steeper the line, the faster the object is travelling. Calculate gradient using .
-
Horizontal lines mean stopped: When the line is flat, the object is stationary – there's a rest period with no movement.