Linear Models (HSC SSCE Mathematics Standard): Revision Notes
Linear Models
What are linear models?
Linear models are mathematical representations of real-world situations using linear functions. When we observe a relationship between two quantities that changes at a constant rate, we can describe this relationship using a linear equation. This allows us to make predictions, solve problems, and understand patterns in everyday contexts.
The most common form for expressing a linear model is the gradient-intercept form:
Understanding the gradient-intercept form:
In the equation :
- represents the dependent variable (the output or result)
- represents the independent variable (the input or what we control)
- represents the gradient (the rate of change)
- represents the vertical intercept (the starting or initial value)
Real-world example: iTunes collection
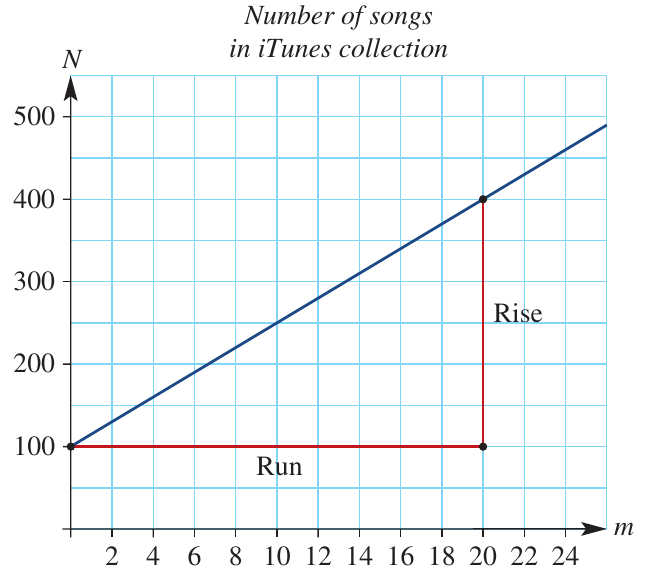
Consider Logan's music collection. He starts with songs and adds new songs every month. We can create a linear model to represent this situation.
Worked Example: Modelling a Music Collection
Let be the number of songs and be the number of months. The equation becomes:
In this model:
- The gradient is (songs added per month)
- The vertical intercept is (initial number of songs)
- The number of months must be greater than zero and a whole number
Key features of linear models
Every linear model has two important characteristics that help us understand the situation it represents.
The gradient (rate of change)
The gradient tells us how quickly one quantity changes in relation to another. It represents the rate of change and is calculated using:
Calculating the Gradient:
This formula tells us how much the dependent variable changes (rise) for each unit change in the independent variable (run).
In Logan's iTunes collection:
- The gradient is
- This means the collection grows by 15 songs per month
- We can also express this as songs (from the graph), which simplifies to songs per month
Exam tip: The gradient always includes units. In linear models, clearly state what the gradient represents (e.g., "songs per month" or "dollars per policy").
The vertical intercept (starting value)
The vertical intercept is the value of when . It represents the initial or starting value in most real-world contexts.
In Logan's iTunes collection:
- The vertical intercept is
- This represents the initial number of songs he owned before adding any new ones
- On a graph, this is where the line crosses the vertical axis
Working with linear graphs
Reading values from graphs
Linear graphs allow us to quickly find corresponding values between two quantities. We can read values in both directions.
Worked Example: Currency Conversion
The graph below converts Australian dollars (AUD) to New Zealand dollars (NZD).
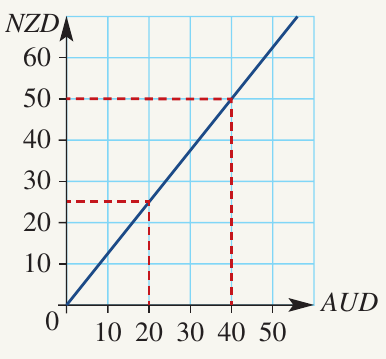
Part a: Convert $40 AUD to NZD
- Locate on the horizontal (AUD) axis
- Draw a vertical line up to meet the graph
- Draw a horizontal line across to the vertical (NZD) axis
- Read the value: $50 NZD
Part b: Convert $25 NZD to AUD
- Locate on the vertical (NZD) axis
- Draw a horizontal line across to meet the graph
- Draw a vertical line down to the horizontal (AUD) axis
- Read the value: $20 AUD
Finding equations from graphs
To create an equation from a linear graph, we need to determine two things: the gradient and the vertical intercept.
Worked Example: Weekly Income with Commission
Grace sells insurance policies. She earns a base salary plus commission on each policy sold. The graph shows her weekly income () against the number of policies sold ().
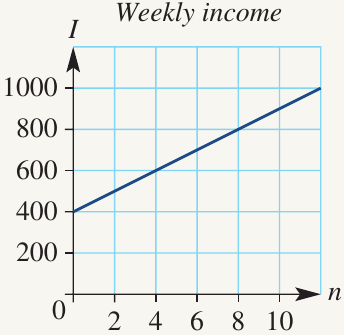
Part a: What is Grace's base salary?
The base salary is the amount Grace earns when she sells zero policies. Looking at the graph when , we find .
Grace's base salary is $400 per week
Part b: What is Grace's salary when she sells 8 new policies?
- Locate on the horizontal axis
- Read up to the line and across to find the income
- When , we find
Grace earns $800 for the week
Part c: How many policies must Grace sell to earn $700?
- Locate on the vertical axis
- Read across to the line and down to find the number of policies
- When , we find
Grace needs to sell 6 new policies
Part d: Find the equation of the line in terms of and
To find the equation, we need the gradient and the intercept.
Step 1: Choose two clear points from the graph
- Point 1:
- Point 2:
Step 2: Calculate the gradient using the formula
Step 3: Identify the vertical intercept
From the graph, when ,
Therefore,
Step 4: Write the equation using
Using the appropriate variables:
Part e: Use the equation to calculate weekly income when Grace sells 3 new policies
Substitute into the equation:
Grace earns $550 when she sells 3 policies
We can verify this answer by checking the graph at .
Part f: How much does Grace earn for each new policy?
The gradient of the graph represents the commission per policy. We calculated the gradient as .
Grace earns $50 commission for each new policy
Understanding context in linear models
When working with linear models, always consider what the mathematical features mean in the real-world context.
Interpreting Linear Models in Context:
-
Gradient: Represents the rate of change. Ask yourself: "How much does the dependent variable change for each unit increase in the independent variable?"
-
Vertical intercept: Represents the starting value or baseline. Ask yourself: "What is the value when the independent variable is zero?"
-
Domain restrictions: Some linear models have constraints. For example, Logan's months must be whole numbers greater than zero (you cannot have negative months or half a month).
Exam tip: When interpreting linear models, always include appropriate units and context in your answers. Don't just state numbers – explain what they represent in the situation.
Key Points to Remember:
- Linear models represent real-world situations using linear functions of the form
- The gradient () represents the rate of change and is calculated using
- The vertical intercept () represents the initial or starting value when the independent variable equals zero
- To find an equation from a graph, identify two clear points, calculate the gradient, determine the intercept, and substitute into
- Always interpret your answers in context – explain what the numbers mean in the real-world situation