Motion Along a Straight Line (HSC SSCE Physics): Revision Notes
Motion Along a Straight Line
Introduction to motion in physics
Throughout history, people have tried to understand how and why objects move. Ancient Greek philosopher Aristotle believed that heavier objects naturally fell faster than lighter ones, and that objects needed a continuous force to keep moving. These ideas were used for nearly 2000 years, but not every observation could be explained by them.
Scientists like Galileo and Newton revolutionised our understanding of motion by carefully observing and experimenting. They developed new explanations that we still use today to describe most types of motion. These explanations are called models – simplified representations that help us understand complex real-world behaviour.

Frame of reference
To describe motion accurately, we need a frame of reference – this is a coordinate system with a fixed point called the origin from which we measure positions. For example, when describing the motion of an aeroplane, we typically use the Earth's surface as our frame of reference. When studying Venus's orbit, we might use the Sun as our reference point.
Interestingly, our frame of reference can itself be moving! Earth travels around the Sun at approximately , yet we still use it as a frame of reference for describing everyday motion. This shows that motion is relative – what matters is choosing a consistent reference point for your measurements.
Centre of mass
Real objects like cars have many moving parts and occupy space. To simplify our calculations, physicists model objects as if all their mass were concentrated at a single point called the centre of mass. This is the average position of all the matter in the object.
For example, when we analyse a car's motion, we treat it as a single point at its centre of mass, even though it's obviously not a point. This simplification makes calculations much more manageable whilst still providing accurate results for the overall motion.
Distance and displacement
To describe how an object moves, we need two pieces of information: where the object is (its position) and when it's there (the time). Position and time are fundamentally linked – an object cannot teleport from one place to another; it takes time for position to change.
Position is measured as the distance from a reference point, usually called the origin (O). We can represent this using a number line, similar to those in mathematics.
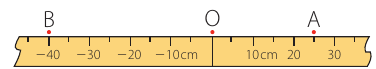
In the diagram above, point A is 25 cm from the origin O, whilst point B is 40 cm from O. To show direction, we use positive and negative values: positions to the right of O are positive (+), whilst positions to the left are negative (−). Therefore, point A is at +25 cm and point B is at −40 cm from the origin.
Distance (scalar quantity)
Distance, symbol , is the total path length between two points. It has magnitude (size) but no direction. For instance, the distance between points A and B in the figure above is simply 65 cm – we just add the lengths without worrying about direction.
Distance is a scalar quantity – a number that only has size, not direction. When measuring distance, we only care about how far we've travelled, not which way we went.
The SI unit for distance is the metre (m). Other common units include centimetres (cm) and kilometres (km).
Displacement (vector quantity)
Displacement, symbol , measures the change in position from a starting point. Unlike distance, displacement includes both magnitude and direction, making it a vector quantity. We write vectors with a small arrow above the symbol: .
For straight-line motion, we indicate direction using positive or negative signs. The displacement tells us not just how far something has moved, but also which direction from the origin.
Distance vs Displacement – A Common Mistake
Consider a marathon runner: if the starting line and finish line are at the same location, the runner's displacement at the end is zero (they're back where they started), even though the distance run was 42.2 km. At various points during the race, the runner's displacement might have been several kilometres, representing how far they were from the start in a straight line.
Remember: Distance is the total path travelled; displacement is the straight-line distance from start to finish with direction.
The SI unit for displacement is also the metre (m).
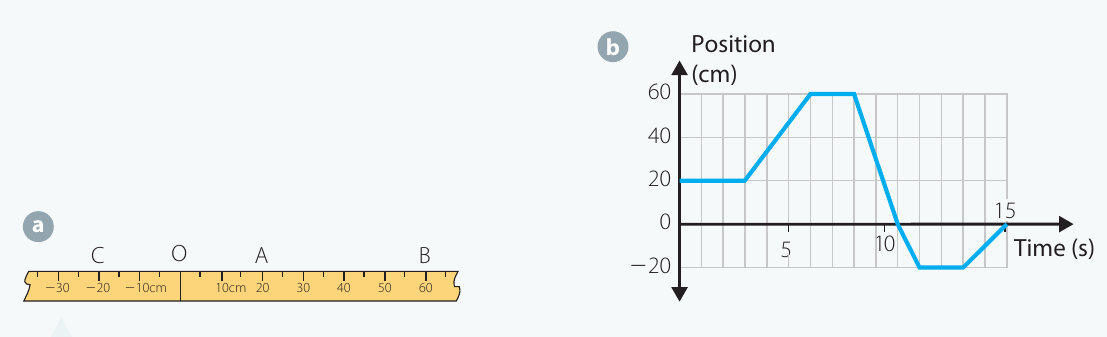
Worked example: the snail's journey
Let's examine a complete example to understand the difference between distance and displacement.
Worked Example: Distance vs Displacement
Question 1: What total distance did the snail travel?
Solution:
- First leg: 20 cm to 60 cm = 40 cm
- Second leg: 60 cm to −20 cm = 80 cm (passing through zero)
- Third leg: −20 cm to 0 cm = 20 cm
- Total distance = 40 + 80 + 20 = 140 cm
Question 2: What was the snail's final displacement relative to: (a) its starting point? (b) the origin?
Solution:
(a) Using the formula (final position minus initial position):
- Initial position: cm
- Final position: cm
- Displacement: −20 cm
This means the snail ended up 20 cm to the left of where it started.
(b) The snail finishes at the origin, so its displacement relative to the origin is zero.
Key Insight: This example clearly shows that distance (140 cm) and displacement (−20 cm or 0 cm depending on reference) are different concepts!
Scalars and vectors
Understanding the difference between scalars and vectors is crucial in physics.
Scalars have only magnitude (size). Examples include:
- Distance: "I walked 5 km" – no direction needed
- Speed: "The car travelled at 60 km/h" – just how fast, not which way
- Time: "The journey took 3 hours"
- Temperature, mass, energy
Vectors have both magnitude and direction. Examples include:
- Displacement: "The treasure is 100 m north of the tree"
- Velocity: "The plane flew at 200 m/s eastward"
- Force, acceleration
Vector Notation in Physics
In physics notation, we write vectors with a small arrow above the symbol (e.g., for displacement), whilst scalars have no arrow (e.g., for distance).
| Scalars | Vectors |
|---|---|
| Distance, | Displacement, |
| Speed, | Velocity, |
Always pay attention to whether a quantity is a scalar or vector – it affects how you calculate and interpret results!
Time, speed and velocity
Time intervals
The position of an object is measured at a particular time, . The SI unit for time is the second (s).
Motion involves change in position over time. We represent a time interval as (read as "delta t"), where:
Here, represents the amount of time that has elapsed between two measurements. Note that is a single symbol, not delta times . Sometimes it's written simply as , but it still means the time interval .
Speed (scalar quantity)
Speed, symbol , measures how fast something is travelling. It's the rate at which distance changes as time passes.
Speed can be measured by observing the distance travelled and dividing by the time taken:
where is the distance travelled and is the time taken.
The SI unit for speed is metres per second, written as m/s or .
Speed is a scalar – it only tells us how fast, not which direction. This applies whether we're measuring the instantaneous reading on a car's speedometer or calculating the average speed for a whole journey.
Velocity (vector quantity)
The change in distance is called the distance interval, symbol (no arrow – it's not a vector):
The change in displacement is called the displacement interval, symbol (with arrow – it is a vector).
Velocity is the rate of change of displacement as time changes:
The SI unit for velocity is the same as for speed: metres per second ().
Speed vs Velocity – Know the Difference!
In everyday language, people often use "speed" and "velocity" to mean the same thing. In physics, however, they're distinct:
- Speed relates to distance covered (scalar)
- Velocity relates to displacement change (vector)
Speed is the magnitude of velocity. For straight-line motion, velocity direction is shown as positive or negative. Generally, the velocity direction matches the direction of displacement change.
Relationship between speed, distance and time
If you walk steadily at 2 paces per second (2 paces ), in 10 seconds you'll move 20 paces. Using standard units (metres) allows us to describe any motion consistently:
Rearranging this formula:
This tells us the distance travelled equals speed multiplied by time.
Graphical representations of motion
Distance-time graphs
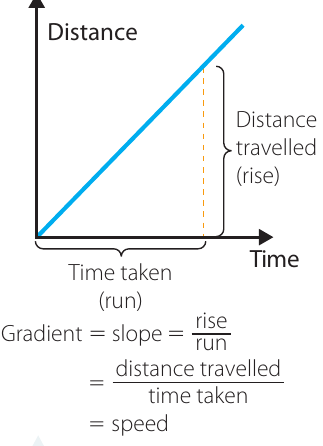
A distance-time graph plots distance on the vertical axis and time on the horizontal axis. The gradient (or slope) of this graph equals the speed.
For motion at constant speed, the gradient remains the same throughout, creating a straight line. The gradient is calculated as:
If speed varies, the line's gradient changes too, creating a curved line.
Exam Tip: Finding Speed from Distance-Time Graphs
To find speed from a distance-time graph, calculate the gradient by finding the change in distance (vertical change) divided by the change in time (horizontal change).
For curved lines, find the gradient of the tangent at a specific point to get the instantaneous speed.
Speed-time graphs and area underneath
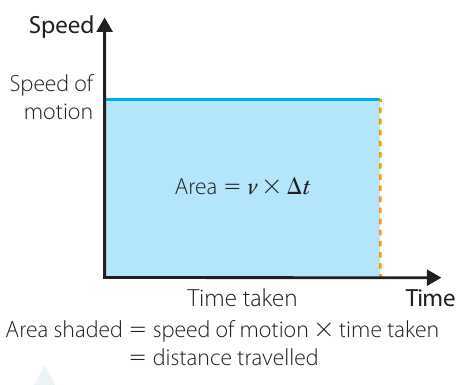
A speed-time graph plots speed on the vertical axis and time on the horizontal axis. For this type of graph, the area under the line equals the distance travelled.
When an object moves at constant speed, the graph is a horizontal line. The area of the rectangle beneath this line equals , which equals the distance travelled:
This relationship () can be verified either by calculation or by finding the area under a speed-time graph.
Key Relationships for Motion Graphs
Remember these two crucial relationships:
- Distance-time graph: Gradient = Speed
- Speed-time graph: Area = Distance
These are frequently tested in exams and essential for solving motion problems!
Worked example: runner with changing speed
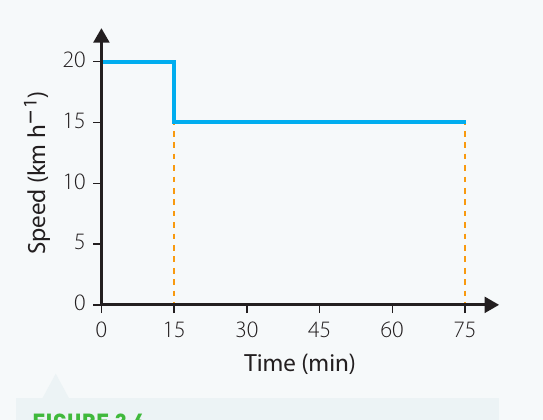
An athlete runs at for 15 minutes. She then gets a stitch and slows to for the next hour.
Worked Example: Finding Distance from a Speed-Time Graph
Question 1: How far does the runner travel in the first 15 minutes?
Solution: The distance is the area under the graph for the first segment.
(Note: 15 minutes = 15/60 hours = 0.25 hours)
Question 2: How far does she run in total?
Solution: Total distance is the sum of both areas:
This example demonstrates that when speed changes instantaneously (drops suddenly at 15 minutes), we can still calculate distance by finding the area under each section of the graph.
Exam Tip: For complex speed-time graphs, break them into simple shapes (rectangles, triangles, trapeziums) and find the area of each section. Add all the areas together to get the total distance travelled.
Average speed and instantaneous speed
Average speed,
When travelling through a city, your speed constantly changes. If you travel 20 km in half an hour, your average speed is:
This doesn't mean you were always moving at . It means that if you had travelled at a constant for the entire journey, you would have covered the same distance in the same time.
Average speed is calculated as:
Worked Example: Calculating Average Speed
What was the average speed of the athlete in the previous example?
Solution:
- Total distance: km
- Total time: hours (15 minutes + 60 minutes = 75 minutes = 1.25 hours)
Notice that the average speed (16 km/h) is different from either of the individual speeds (20 km/h or 15 km/h).
Instantaneous speed,
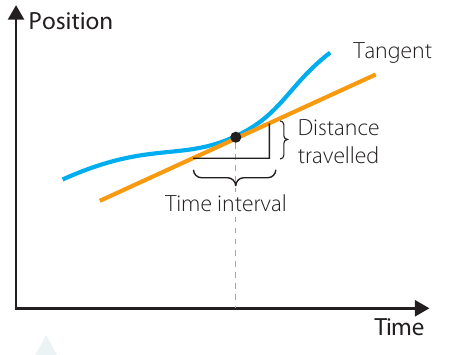
When you glance at a car's speedometer, you see the instantaneous speed – the speed at that exact moment.
Understanding Instantaneous Speed
Measuring true instantaneous speed is actually impossible because we need both distance and time intervals to calculate speed. Every speed measurement is really an average over some time period. However, if we make the time interval extremely small, the average speed becomes very close to the instantaneous speed:
Mathematically, instantaneous speed is found from the gradient of the tangent line to a position-time graph. As the time interval approaches zero, the average speed approaches this gradient value.
Memory Aid: Think of instantaneous speed as the "speedometer reading" – what you'd see at one particular moment if you took a photograph of the speedometer.
Investigation: measuring the speeds of common objects
In this practical investigation, you'll measure how fast various sports equipment can propel objects.
Aim: To measure the speeds of some human-propelled objects
Materials:
- Stopwatch
- Measuring tape
- Various bats, racquets and balls
- Optional: video camera or motion data-logger
Risk assessment:
| What are the risks? | How can you stay safe? |
|---|---|
| A ball hit with a bat could injure people or break windows | Perform the experiment in an open space, such as a school oval, keeping bystanders well back |
Method:
- Measure out an appropriate distance (e.g. 20 m) between two lines on the school oval or in a clear area.
- By either throwing or hitting a ball with a bat or racquet, reproduce the actions of several different ball sports (e.g. cricket, tennis, hockey, golf) that propel a ball from one line past the other.
- Measure the time it takes for the ball to travel the designated distance. Use a stopwatch, or you may be able to video the motion and use the clock on the video. You might also have access to a motion data-logger that can measure speed directly.
- Repeat step 3 for the same sport several times.
- Repeat steps 3 and 4 for a different sport.
Results:
Record the results of your timing measurements for each sport in a table:
| Sport | Trial 1 (s) | Trial 2 (s) | Trial 3 (s) | Average time (s) |
|---|---|---|---|---|
| Cricket | ||||
| Tennis |
Analysis of results:
- Find the average speed of the ball for each sport using . Include an estimate of the uncertainty in each value.
- Convert the results from to (multiply by 3.6).
Discussion:
Discuss the difficulties encountered during this experiment and suggest ways in which the data collection could be made more accurate. Consider:
- Timing accuracy (human reaction time)
- Difficulty keeping the ball on a straight path
- Wind effects
- Variations in hitting strength
Conclusion:
With reference to the data obtained and its analysis, write a conclusion based on the aim of this investigation. State which sport produced the fastest ball speed and compare the speeds measured.
Exam Tip for Investigations
In investigations, always include units with all measurements and show your working when calculating speeds. Clear recording and systematic analysis are essential for good scientific practice.
Detailed speed-time graph analysis
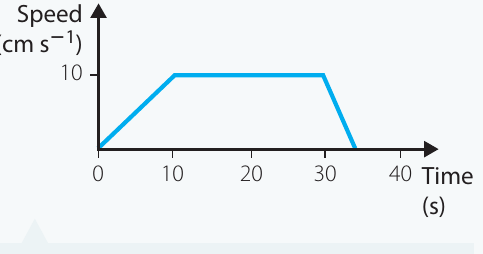
Let's work through a comprehensive example of analysing a speed-time graph.
The graph above shows an object's motion in three stages:
- Speeding up from 0 to (0 to 8 seconds)
- Constant speed at (8 to 30 seconds)
- Slowing down from to 0 (30 to 38 seconds)
Worked Example: Comprehensive Speed-Time Graph Analysis
Question 1: Find the distance travelled in each section.
Solution:
(a) First section (0 to 10 seconds): This is a triangle.
(b) Second section (10 to 30 seconds): This is a rectangle.
(c) Third section (30 to 35 seconds): This is a triangle.
Question 2: Find the average speed for the entire trip.
Solution:
Question 3: How long does the object take to travel 70 cm?
Solution:
After 10 seconds, the object has travelled 50 cm (from part a). It needs to travel another 20 cm.
During the constant speed section, distance = speed × time:
Total time = 10 s + 2 s = 12 s
Memory Aid: When analysing speed-time graphs, remember: "Area = Distance". Break complex shapes into triangles and rectangles.
Relative velocity
Understanding relative velocity
Imagine you're standing beside a road. A car approaches from your left at , and another car approaches from your right at . From your stationary viewpoint, both cars have a speed of .
However, from the perspective of either driver, the other car is approaching at ! This is because each driver sees the other car moving relative to themselves, not relative to the road.
Why Relative Velocity Matters
Relative velocity depends on your frame of reference. It's particularly useful when analysing collisions – a head-on crash at causes much more damage than a crash at .
The concept helps us understand motion from different perspectives and is crucial for analysing interactions between moving objects.
Calculating relative velocity
To analyse straight-line motion situations:
- Choose one moving object and call it the observer (velocity )
- The other object is the distant object (velocity )
The relative velocity is:
This tells us the velocity of the observer as measured from the distant object's frame of reference.
Interpreting Relative Velocity Results
| Situation | Result | Interpretation |
|---|---|---|
| (same direction) | Negative number | is moving in the negative direction with respect to |
| (same direction) | Positive number | is moving in the positive direction with respect to |
| Opposite directions | Positive number | is moving in the positive direction with respect to |
Key Point: When objects travel in opposite directions, is necessarily negative relative to , so always gives a positive number. Whether they're approaching or separating depends on their initial positions, but the relative velocity magnitude stays the same.
Worked example: overtaking
A car travels along a road at . A truck travels in the same direction 100 m ahead at .
Worked Example: Using Relative Velocity
Question 1: How long will it take for the car to overtake the truck?
Solution:
First, find the relative velocity:
This means the car is closing on the truck at .
The car needs to cover the 100 m gap:
Question 2: How far will the car have travelled in that time?
Solution:
Using the car's actual speed (not relative speed):
Notice the difference: the car travels 550 m in total, but only closes the gap by 100 m because the truck is also moving forward.
Exam Tip for Relative Velocity Problems
When solving relative velocity problems:
- Use relative velocity to find the time taken to close the gap
- Use actual velocity to find absolute distances travelled
Don't confuse these two – it's a common mistake that costs marks!
Key Points to Remember
-
Distance is the total path length (scalar), whilst displacement is the change in position from the starting point including direction (vector).
-
Speed is how fast distance is covered (scalar), whilst velocity is the rate of change of displacement including direction (vector).
-
On a distance-time graph, the gradient equals speed:
-
On a speed-time graph, the area underneath equals distance travelled:
-
Average speed = total distance ÷ total time taken:
-
Instantaneous speed is the speed at a particular moment (gradient of tangent to position-time curve).
-
Relative velocity = velocity of observer − velocity of distant object:
This tells you how fast one object is moving relative to another.