Analysing and Interpreting Your Results (HSC SSCE Physics): Revision Notes
Analysing and Interpreting Your Results
Organising your data
The first step when analysing data is to organise it properly. Whether you're working with data you collected yourself (primary data) or data from other sources (secondary data), you'll usually need to create tables.
Every data table must include:
- Headings for each column showing what is being measured
- Units for all measurements
- A caption explaining what the data represents or how it was collected
Tables are essential for recording your raw measurements and for organising any calculations you perform based on those measurements. They help you keep track of your data and make it easier to spot patterns or errors.
Calculating derived data from raw data
Understanding the difference between raw and derived data is crucial for analysing your results effectively.
Raw data is what you actually measure during your experiment. It must always include:
- The numerical value
- The appropriate units
- The uncertainty in the measurement
For example:
Derived data is information you calculate using your raw measurements. For instance, if you measure distance and time, you can derive speed and acceleration.
Working with units
When recording data and performing calculations, always write down the units for every measurement. This practice helps you:
- Ensure you have correct units for all derived quantities
- Check that your equations are dimensionally correct
- Avoid mistakes when converting between units (such as to )
Include units at each step of your calculations, not just at the end.
Calculating uncertainties in derived data
Just as your raw data has uncertainties, all your derived results must also have uncertainties. The rules for combining uncertainties depend on the mathematical operations you're using:
For addition and subtraction: Simply add the absolute uncertainties together.
For multiplication and division: Add the fractional (or relative) uncertainties together.
Worked Example: Calculating Uncertainty for Derived Data
If you're calculating using the equation , the relative uncertainty in equals:
Notice that the relative uncertainty in appears twice because we multiply by (equivalent to multiplying by twice). We don't include uncertainty in the constant because we assume it's an exact number.
For more complex calculations, consult specialised guides such as the Guide to Uncertainties in Measurement.
Drawing and using graphs
Graphs appear in almost every physics research article. They're not just useful for presenting data - they're powerful tools for analysing relationships between variables. You should create multiple graphs during your investigation to explore your data from different perspectives.
Requirements for effective graphs
A good graph must be:
- Large and clear - easy to read and interpret
- Properly labelled - both axes show variable names and units
- Well-scaled - data fills most of the plot area (the origin doesn't need to be shown unless relevant)
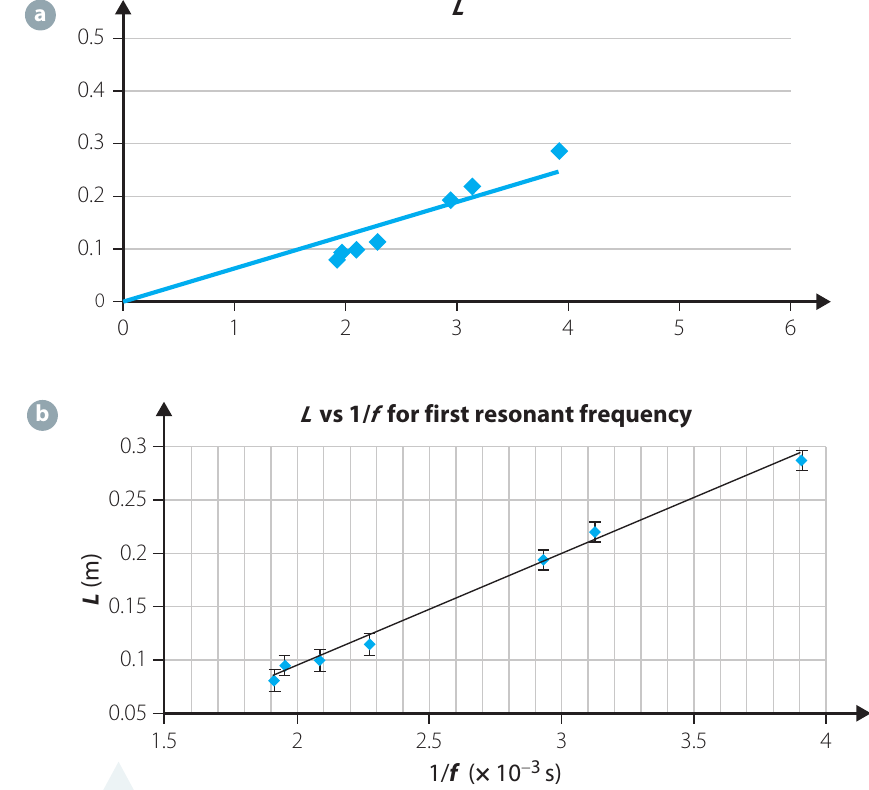
The figure above compares a poor graph (panel a) with a good graph (panel b) using the same data. The good graph has a clear title, properly labelled axes with units, and an appropriate scale that makes the data easy to interpret.
Creating scatter plots
When investigating relationships between variables, use a scatter plot - a graph showing your data as individual points. Don't join the points like a dot-to-dot picture.
Convention dictates that:
- The independent variable (what you control) goes on the -axis
- The dependent variable (what you measure) goes on the -axis
Collecting sufficient data
To determine a relationship reliably, you need:
- Enough data points - minimum of six for linear relationships, but collect as many as reasonably possible
- Wide range - spread your measurements across as large a range as practical
For non-linear relationships (such as curves or oscillations), you need more data points. Collect extra measurements in regions where values change rapidly.
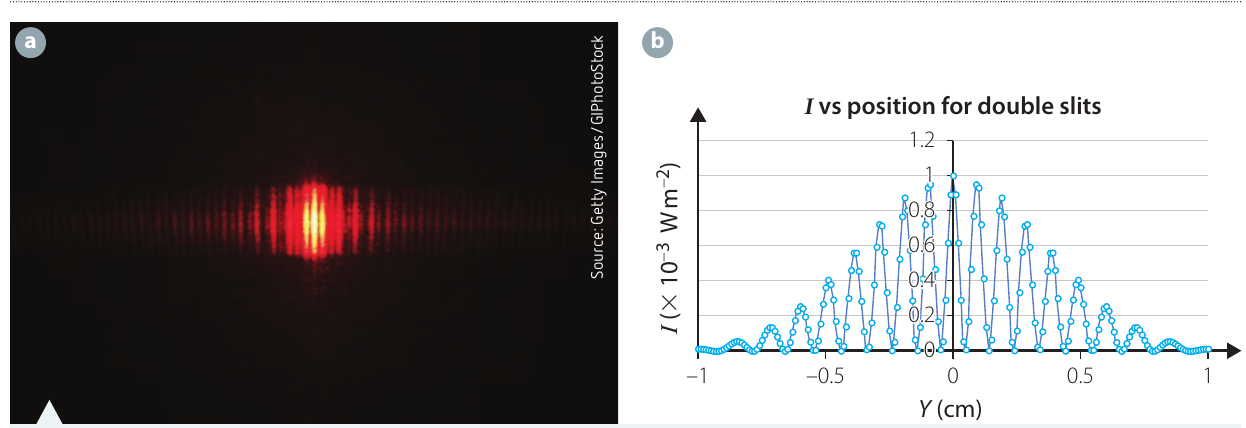
This double-slit interference experiment demonstrates why many data points are necessary for non-linear patterns. Panel (a) shows the interference pattern, while panel (b) plots intensity versus position, requiring numerous measurements to capture the sinusoidal variation.
Fitting linear relationships
If your graph appears linear, fit a straight line using either:
- Hand-drawing a line of best fit
- Linear regression in graphing software
Graphing software calculates an R² value (coefficient of determination) measuring goodness of fit. The closer is to , the better the fit. Values below approximately suggest the relationship may not be linear.
Remember that a linear relationship follows the form:
where:
- is the dependent variable (vertical axis)
- is the independent variable (horizontal axis)
- is the gradient
- is the -intercept
Never force a line of best fit through the origin. The intercept provides valuable information and may reveal systematic errors like calibration problems.
Dealing with outliers
Outliers are data points that don't fit the pattern of other measurements. They might indicate:
- Recording errors or measurement mistakes
- Interesting behaviour at extreme values
- Limitations of your model in certain ranges
You may choose to exclude outliers when fitting a line to your data, but you must justify this decision. Consider whether they reveal something important about your system rather than simply being errors.
Non-linear data and linearising
Not all relationships between variables are linear. If your plotted raw data shows a curve, don't draw a straight line through it. Instead, you have two options:
- Fit a theoretical curve based on your hypothesis
- Linearise the data to create a straight-line relationship
Linearising based on your hypothesis
Linearising means transforming your data into the form . This powerful technique allows you to test whether your hypothesis is correct.
Worked Example: Linearising Height vs Time for a Falling Object
Suppose your hypothesis is that the height of a falling object relates to time by:
where is acceleration due to gravity. Rearrange this into linear form:
Comparing with :
- (plot height on vertical axis)
- (plot time-squared on horizontal axis)
- (gradient should equal half of )
- (intercept should be zero)
Conclusion: If plotting versus produces a straight line with gradient and intercept zero, your hypothesis is supported.
Log-log graphs for power laws
Power laws are relationships of the form:
Taking logarithms of both sides gives:
This is now in linear form! A plot of versus produces a straight line with:
- Gradient = (the power)
- Intercept =
Worked Example: Finding the Power Law Relationship
Consider the relationship between power radiated by a hot filament and its temperature:
| Temperature (K) | Power (W) |
|---|---|
| 1000 | 23 |
| 1100 | 34 |
| 1200 | 48 |
| 1300 | 67 |
| 1400 | 89 |
| 1500 | 117 |
| 1600 | 152 |
| 1700 | 194 |
| 1800 | 243 |
| 1900 | 301 |
| 2000 | 370 |
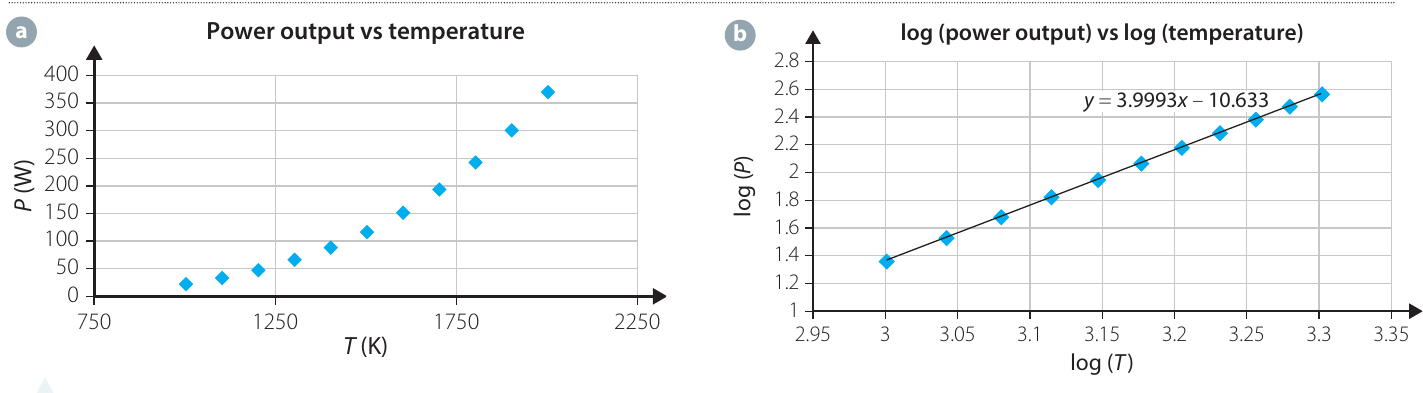
Panel (a) shows that plotting power versus temperature directly produces a curve - clearly not linear. Panel (b) shows the log-log plot of the same data, which produces a beautiful straight line with equation:
Interpreting the results:
- The gradient is , so
- The intercept is , so
Therefore:
The relationship is:
This powerful technique reveals the mathematical relationship between variables. It's always better to linearise data rather than trying to fit curves, because different types of curves (exponential, power law, etc.) can look very similar when plotted directly.
Interpreting your results
After analysing your results, you must interpret them. This means answering your research question or determining whether your results support your hypothesis.
Considering uncertainties
Always account for uncertainties when deciding if results support your hypothesis.
Worked Example: Interpreting Results with Uncertainties
Suppose you hypothesised that a rocket's maximum range occurs at a launch angle of , but your results show maximum range at . Does this disprove your hypothesis?
- If your uncertainty is , then your result does NOT include , so the hypothesis is not supported
- If your uncertainty is or more, then your result DOES include , so the hypothesis is supported
This demonstrates why calculating uncertainties is essential for testing hypotheses.
When hypotheses are not supported
If your hypothesis is not supported, don't simply conclude "our hypothesis is wrong." Instead, investigate why:
- Is your model too simple? For example, if you ignored air resistance but it significantly affects your results, you may need a more sophisticated model
- Have you made calculation errors or measurement mistakes? Check carefully before blaming the model
- Does your result reveal limitations of the theory in certain conditions?
Never conclude that "the experiment didn't work." Either mistakes were made, or the model wasn't appropriate for your situation. Your job is to determine which.
Experiments that contradict predictions from existing models are crucial for scientific progress. They reveal gaps in our understanding and drive scientific curiosity.
Evaluating your investigation
After completing your investigation, evaluate it critically by considering:
Validity and reliability:
- Is your experiment reproducible? Would others get similar results?
- Is your data accurate? Do measurements reflect true values?
Precision and hypothesis testing:
- Is your data precise enough that your hypothesis is clearly supported or disproved?
- Does your data distinguish between competing models?
Limitations:
- Do your findings apply broadly or only to specific situations?
- What assumptions did you make that might limit applicability?
Improvements:
- Don't focus only on equipment limitations
- Consider how you could improve your technique, experimental design, or even your research question
- What would you do differently if repeating this investigation?
Key Points to Remember:
- Organise data in tables with proper headings, units, and captions for both raw and derived measurements
- Always include units at every step of calculations to avoid errors and verify dimensional correctness
- Propagate uncertainties correctly: add absolute uncertainties for addition/subtraction; add fractional uncertainties for multiplication/division
- Create effective graphs that are large, clear, properly labelled, and scaled to fill the plot area
- Linearise non-linear data based on your hypothesis, or use log-log plots to identify power law relationships
- Consider uncertainties when interpreting results - they determine whether your hypothesis is supported or not
- Evaluate critically by examining validity, reliability, limitations, and potential improvements to your investigation