Communicating Your Understanding (HSC SSCE Physics): Revision Notes
Communicating Your Understanding
Why communication matters in science
Research isn't complete until you share your findings with others. Without communication, no one can learn from your work or build upon your discoveries. While formal reports are the most common method, scientists use many ways to share their research including posters, presentations, websites, and videos. Your choice of communication method should match both your content and your intended audience.
Writing formal scientific reports
A formal scientific report follows a carefully structured format that helps readers understand your investigation clearly and systematically. Think of it as telling the complete story of your research in a logical sequence.
Structure of a report
Every formal report contains these distinct sections:
- Abstract – Brief overview of the entire report
- Introduction – Background and research question
- Method – What you did and how
- Results and analysis – What you found
- Discussion – What your results mean
- Conclusion – Summary of findings
- Acknowledgements – Thanks to helpers
- References – Sources cited in the report
- Appendices – Additional data and information
Critical Rule: Always write reports in past tense because you're describing work you've already completed. For example, write "We measured the temperature" not "We measure the temperature."
The abstract
The abstract summarises your entire investigation in 50-200 words. Write it last, even though it appears first in your report. A good approach is to write one sentence summarising each major section of your report. This gives readers a quick overview so they can decide if they want to read the full report.
Tip for Writing Abstracts: One effective strategy is to write exactly one sentence for each major section: Introduction, Method, Results, Discussion, and Conclusion. This ensures your abstract covers all key aspects of your work.
The introduction
Your introduction answers the question "Why did I do this research?" It needs to:
- Explain your motivation – Why is this research interesting or important?
- Provide background information – Include a literature review with the context readers need to understand your work
- Present specific theory – State relevant equations and theories
- State your research question or hypothesis – Make it clear what you're investigating
For both primary-sourced (experimental) and secondary-sourced (literature-based) investigations, you must reference all your sources correctly. The introduction builds from general background to specific details, finishing with your precise research question.
The method
The method section describes what you did and how you did it. Write it in past tense (e.g. "We measured the temperature every 10 seconds" not "measure the temperature every 10 seconds").
For primary-sourced investigations:
- Describe your experimental procedure in enough detail that someone with similar knowledge could repeat your work
- Include large, clear diagrams of equipment setup, circuits, and apparatus
- Explain briefly why you chose particular methods or techniques
Your logbook contains rough sketches, but formal reports need neat, professionally redrawn diagrams:
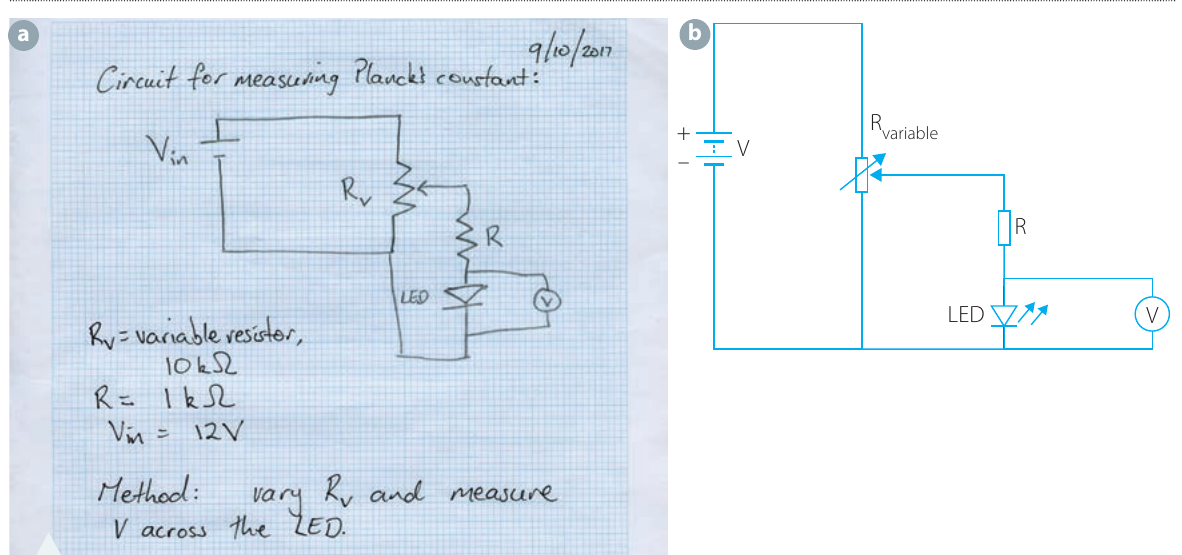
The difference between logbook sketches and formal report diagrams is important. Logbook sketches are for your personal understanding during the investigation, while formal diagrams need to clearly communicate your setup to others who weren't present.
For secondary-sourced investigations: The method section is usually shorter. Describe what literature searches you conducted and explain how you decided which sources to use.
Results and analysis
This section summarises what you found. Often the results and analysis are combined, though they can be separate sections.
Key points for presenting results:
- Use graphs instead of long tables wherever possible
- Include only summary tables in the main report – put raw data in appendices
- Present all data with appropriate SI units and uncertainties
- Show equations you used for calculations
- Include one sample calculation if you repeated the same procedure multiple times
Choosing the right type of graph:
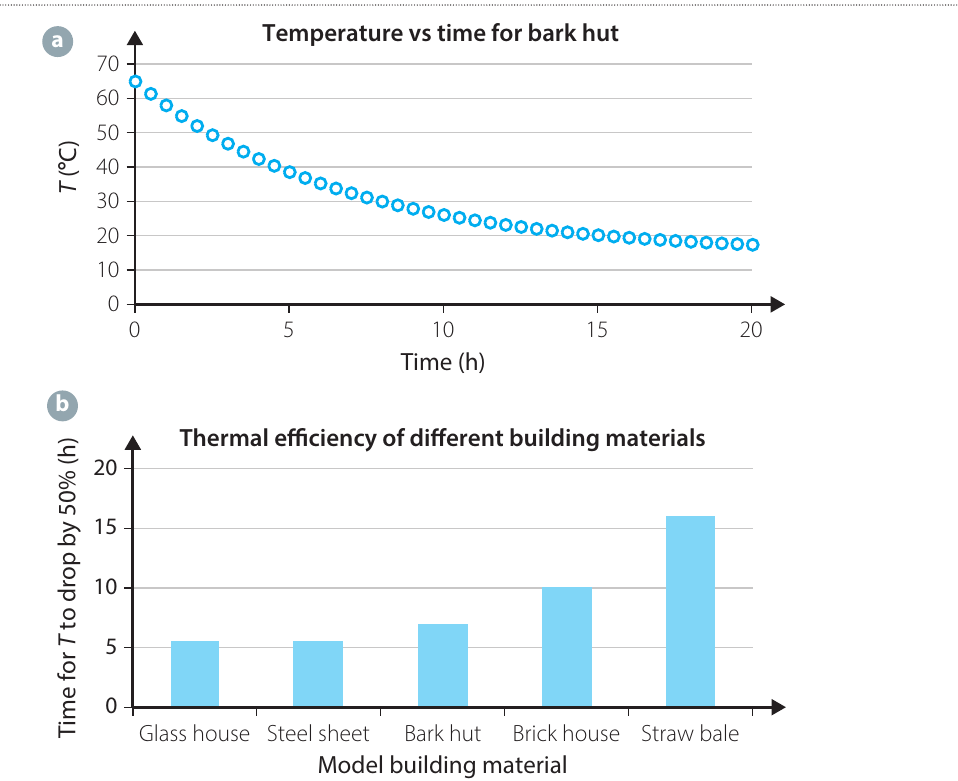
Scatter plots show relationships between two variables. Display data as points with uncertainty bars and label any fitted lines clearly. Use scatter plots when investigating how one variable affects another.
Column and bar charts compare different categories or data sets. Use these to show differences between experimental conditions or materials. Never use bar charts to show mathematical relationships between continuous variables.
Common Mistake to Avoid: Never use bar charts to display relationships between continuous variables. Bar charts are only for comparing categories or discrete data sets. If you're showing how one continuous variable affects another, always use a scatter plot.
The discussion
Your discussion explains what your results mean. This is where you interpret your findings and connect them to your research question or hypothesis.
What to include:
- Highlight important results – Draw attention to key findings and explain them
- Make comparisons – Compare your results with predictions or with other studies
- Answer your research question – If you started with a question, answer it here
- Address your hypothesis – State whether your results supported or contradicted your hypothesis. If they didn't support it, explain why
- Evaluate your investigation – Discuss limitations and problems you encountered
- Suggest future work – If your investigation raised new questions, explain what further research could be done
Important Consideration: Don't immediately blame your model if results don't match predictions. First check carefully for experimental errors or mistakes in your procedure. Many apparent discrepancies between theory and experiment are actually due to measurement issues or procedural problems.
The conclusion
Keep your conclusion brief – just a few sentences. Summarise what you found and what it means. The conclusion shouldn't introduce new information; it simply restates your main findings and their significance.
Acknowledgements
Thank people and organisations who helped with your investigation. This includes those who:
- Provided equipment or funding
- Gave you useful ideas
- Helped with analysis
- Offered other forms of support
In science, as in life, it's important to acknowledge help received.
References and bibliography
References list all sources you actually cited in your report. Every time you use information or a quotation in your report, you must reference it. There are two common formats:
- Numbered format: [2]
- Author-date format: (Smith, 2014)
The reference list appears either as footnotes on each page or as a complete list at the end of the report. Check with your teacher which format to use.
Bibliography lists sources that are useful for understanding the research, whether or not you cited them directly.
- Primary-sourced investigations: Include references but not usually a bibliography
- Secondary-sourced investigations: May include both references and bibliography to show the scope of your literature search
- For annotated bibliographies, the bibliography itself may be a major report section
Critical Distinction:
- References = sources you actually cited in your report
- Bibliography = all relevant sources, whether cited or not
Don't confuse these two! Every citation in your report must appear in your reference list, but your bibliography can include additional useful sources.
Presenting data effectively
Tables vs graphs
Use graphs instead of tables whenever possible. Graphs make patterns and relationships much clearer than columns of numbers. However, tables are useful for:
- Comparing results from different experiments
- Summarising key findings
- Presenting secondary sources
Avoid including long tables of raw data in your main report. Put these in appendices instead.
When to Use Tables: While graphs are generally preferred, tables excel at presenting exact numerical values when precision matters, comparing multiple data sets side by side, or summarising information that doesn't show clear trends or relationships.
Understanding uncertainty
Always include uncertainties with your measurements. Present them correctly:
- Show uncertainty bars on graphs
- State uncertainties with numerical results
- Use appropriate significant figures
This helps readers understand the precision and reliability of your findings.
Never Present Data Without Uncertainties: Measurements without uncertainties are essentially meaningless in science. Every experimental value has some degree of uncertainty, and presenting data without acknowledging this gives a false impression of precision.
Alternative communication methods
Posters
Posters are less formal than reports but still need to communicate clearly. They:
- Use more images than text
- Present information visually
- Need clear, logical organisation
- Should be readable from a distance
Make sure all images are relevant and support your message.
Websites and videos
When creating digital content, consider:
Websites:
- Use accessibility features (large fonts, image tags)
- Ensure content works for people with disabilities
- Balance text with images
- Make navigation clear and logical
Videos:
- Know your audience and what appeals to them
- Balance educational content with entertainment
- Keep your message clear and focused
- Use visuals to support explanations
Accessibility Matters: When creating digital content, always consider users with different needs. Features like alt text for images, captions for videos, and high-contrast text help ensure everyone can access your scientific communication.
Acknowledging sources
All communication methods need proper acknowledgement of sources, not just formal reports. Be careful with copyright – you usually cannot copy images from websites without permission. Always check if permission is given, and talk to your teacher about the appropriate way to acknowledge sources in different formats.
Choosing your method
Before creating any communication:
- Know your message – What do you want to say?
- Know your audience – Who are you talking to?
- Choose appropriate language and style for both
Once you're clear on these points, you can effectively share the interesting discoveries from your investigation.
Remember!
- Communication completes science – Research isn't finished until results are shared with others
- Reports follow a standard structure – Abstract, Introduction, Method, Results, Discussion, Conclusion, plus Acknowledgements, References, and Appendices
- Always write in past tense – You're describing work already completed
- Choose graphs wisely – Scatter plots for relationships, bar charts for comparisons
- Reference everything – Cite all sources you use, whether in reports or other formats
- Match method to audience – Different communication formats suit different audiences and purposes
- Include uncertainties – Present all data with appropriate SI units and measurement uncertainties