Implementation and Collecting Data (HSC SSCE Physics): Revision Notes
Implementation and Collecting Data
Scientific logbooks
A logbook is your primary working document when conducting scientific investigations. It serves as the complete record of everything you do during your research and acts as important evidence if your work is questioned.
Why logbooks matter:
- They are the main source of information when writing up scientific work
- They serve as legal documents in professional science
- They can be used as evidence in court cases (patent disputes, misconduct claims)
- They are essential for evaluating your investigation
What makes a good logbook
Your logbook should be a complete record, even if it's not perfectly neat. Every entry must be dated, and you should record information in indelible form (use pen, not pencil). If using an electronic logbook, never delete data - just label it appropriately.
A complete logbook contains:
- Planning notes for your investigation
- Records of when, where, and how you carried out each experiment
- Names of everyone you worked with during each session
- Diagrams of experimental setups and circuit diagrams
- All raw results (measurements you actually took)
- All derived results, analysis, and graphs
- Ideas you had while planning, experimenting, and analysing
- Printouts and file locations of any data not recorded directly
Key recording rules:
- Write down what you do as you do it - don't rely on memory
- Record all measurements immediately and directly into your logbook
- Never use scrap paper for data collection
- Never use white-out or pencil for results
- If you need to cross something out, draw a single line through it and explain why
- In electronic logbooks, don't delete - label and keep everything
Data collection methods
Secondary-sourced investigations
When conducting secondary research, your literature review forms the basis of your investigation. This is not simply summarising what you've read - you must add meaning and critically evaluate both the sources and the current state of knowledge.
Adding meaning involves:
- Comparing and contrasting competing models
- Constructing arguments based on evidence
- Analysing and presenting data from multiple sources
When working with secondary sources, you need to evaluate them carefully. Apply the CRAAP test to assess source quality. Consider experimental limitations and check reliability - have others repeated the experiments? Assess whether experiments can distinguish between competing hypotheses. Compare data and claims across multiple reputable sources (scientific texts, journals, reputable websites) and reference all sources appropriately.
Evaluating the field:
- Identify existing models
- Determine which hypotheses have been tested
- Identify unanswered questions
Primary-sourced investigations
When collecting your own data, you'll perform measurements through experiments or field observations. Understanding variables is crucial for designing effective experiments.
Types of variables:
- Independent variable: The variable you control and deliberately change
- Dependent variable: The variable you measure (assumed to depend on the independent variable)
- Controlled variables: Variables you keep constant to prevent interference with results
Making repeat measurements
Whenever possible, make repeat measurements. This allows you to check that your results are reliable - meaning that repeated measurements under the same conditions give consistent results within experimental uncertainty.
If a result cannot be reproduced, it's not reliable. This might indicate that an uncontrolled variable is affecting your measurements.
When this happens, you need to:
- Identify the uncontrolled variable
- Control it if possible
- Document this in your logbook
Planning data collection
How many data points?
- Minimum of 6-10 data points for linear relationships (straight-line graphs)
- More data points needed for non-linear relationships
- Collect more data where the dependent variable changes rapidly
Worked Example: Temperature Measurement Strategy
When measuring temperature of a cooling object, take more measurements early in the process when cooling is fastest. This is where the dependent variable (temperature) changes most rapidly, so you need more frequent data points to capture the behaviour accurately.
Creating data tables:
- Label columns with variable names and units
- Record uncertainties either at the top of each column (if constant) or in each cell with the measurement
Analysing as you collect
Start analysing your data while still collecting it. This helps you:
- Spot outliers (unusual results) that you can repeat
- Identify mistakes early - cross out errors with a single line, record new data, and add a comment
- Notice interesting patterns that might lead to new questions
- Decide whether to revise your hypothesis or continue with your plan
Many exciting investigations start with one question but end up answering a completely different one!
Accuracy and precision of measurements
Understanding accuracy and precision is essential for evaluating the quality of your measurements. These are different concepts that students often confuse.
Accuracy
Accuracy refers to how close your measurement is to the 'true value' of what you're measuring. When you take repeated measurements, the mean (average) should be close to the true value.
However, systematic errors can make measurements consistently differ from the true value. A common example is parallax error - when reading a needle on a scale from the side, your reading will consistently differ from the driver's reading because the needle sits above the scale. Always be aware of parallax error with needle indicators.
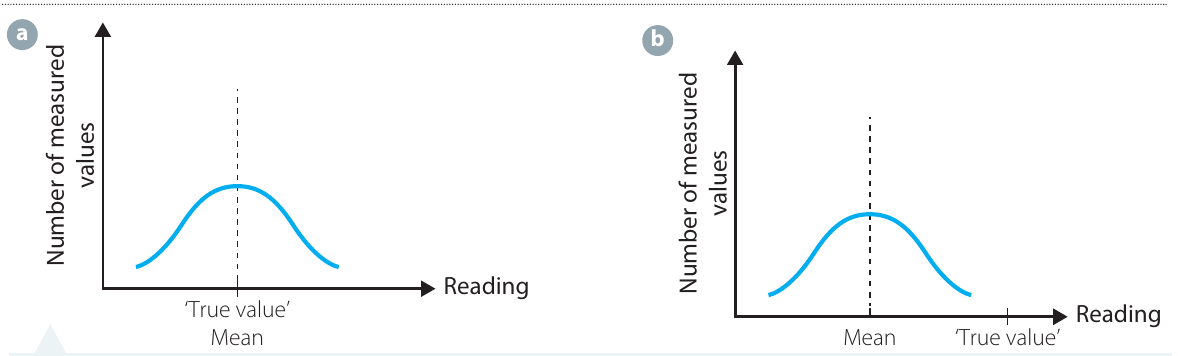
The diagram above shows:
- (a) Accurate measurements clustering around the true value
- (b) Inaccurate measurements with systematic error - they cluster around a different value
Precision
Precision measures the variability or spread in your measurements. The smaller the spread, the greater the precision. Precise measurements cluster closely together, regardless of whether they're accurate.
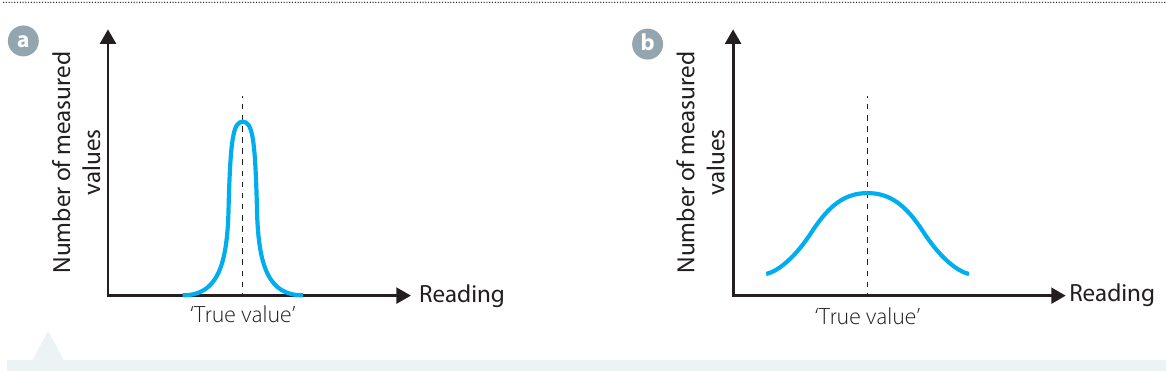
This diagram illustrates:
- (a) High precision - narrow spread of measurements
- (b) Low precision - wide spread of measurements
Both sets of data can have the same accuracy (same average value) but different precision.
The archery analogy
Worked Example: Understanding Accuracy and Precision
Think of accuracy and precision like archery:
- Accuracy = how close to the bullseye (centre) your arrows land
- Precision = how tightly grouped your arrows are
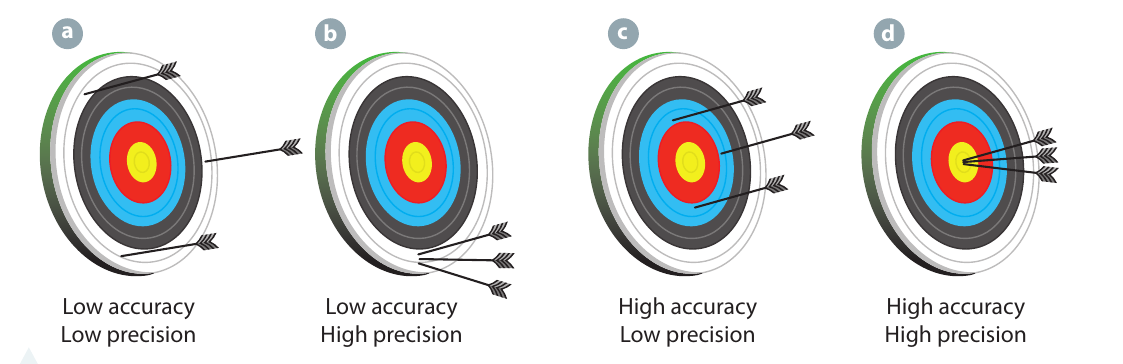
The four targets show:
- (a) Low accuracy, low precision - arrows scattered away from centre
- (b) Low accuracy, high precision - arrows grouped together but away from centre
- (c) High accuracy, low precision - arrows scattered around the centre
- (d) High accuracy, high precision - arrows tightly grouped at the centre (ideal!)
Estimating uncertainties
Every measurement has some uncertainty. You must estimate and record these uncertainties because they determine whether your experiment supports or disproves your hypothesis.
Three sources of uncertainty
The three sources of uncertainty:
- Limit of reading of the measuring device (also called resolution)
- Precision of the measuring device
- Variation of the measurand (the thing being measured)
The uncertainty in your measurement is whichever is greatest of these three.
Limit of reading
For analogue devices (continuous scales like liquid-in-glass thermometers or needle meters):
- Limit of reading = half the smallest division on the scale
- You can usually see which division mark the indicator is closest to
Worked Example: Analogue Thermometer
A thermometer marked in degrees Celsius has a limit of reading of
For digital devices (numerical displays like digital thermometers):
- Limit of reading = one whole division
- It's a whole division because you don't know if the device rounds up or down
Worked Example: Digital Thermometer
A digital thermometer reading to whole degrees has an uncertainty of
Common misconception: Many students think digital devices are more precise than analogue ones. This is often incorrect! A digital device may be easier to read, but that doesn't make it more precise.
Device precision
The measuring device has its own precision, usually stated in the user manual. This is often greater than the limit of reading.
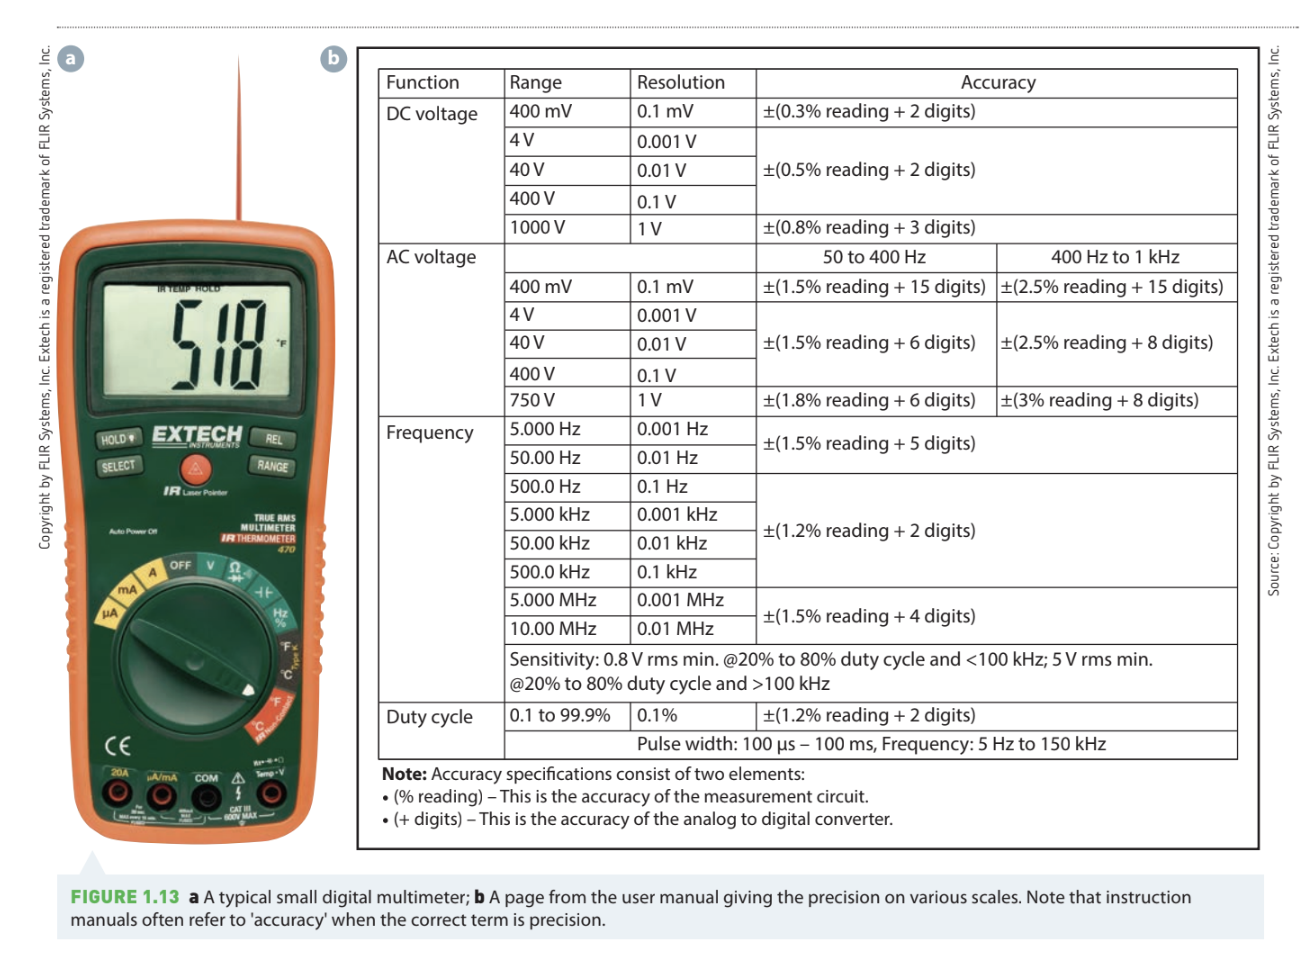
Worked Example: Multimeter Precision
The multimeter shown has a precision of 1.5% on a voltage scale. If you measure :
- Uncertainty from precision =
- This is much greater than the limit of reading ()
This precision represents repeatability - even if the voltage stays constant, the reading could vary by .
Measurand variation
Sometimes the thing you're measuring actually varies. For example, a water rocket's height depends on wind, launch conditions, and many other factors. Even with careful control, repeat measurements may not give identical results.
Recording variation:
- Watch the measurement and record maximum and minimum values
- For digital displays, note how readings change
- For needle meters, observe how far the needle moves
Calculating uncertainty from variation
When you observe a range of values:
Worked Example: Fluctuating Multimeter Reading
If a multimeter reading fluctuates between and :
- Range =
- Measurand =
- Uncertainty =
- Record as:
Note: Both measurement and uncertainty are in brackets with the unit applying to both.
Repeat measurements and standard deviation
For repeat measurements under the same conditions:
- Best estimate of measurand = average value
- With fewer than 10 measurements: uncertainty = half the range
- With more than 10 measurements: uncertainty = standard deviation
where is each individual measurement, is the average, and is the total number of measurements. Most calculators and spreadsheet software can calculate this for you.
Absolute vs fractional uncertainty
Absolute uncertainty:
- Has the same units as the measurement
- Example: when measuring height
Fractional (or relative) uncertainty:
- Absolute uncertainty as a fraction of the measurement
- Usually expressed as a percentage
- Has no units
Worked Example: Calculating Fractional Uncertainty
Height = with uncertainty =
Remember!
Key Points to Remember:
- Logbooks must be complete and in indelible form - record everything as you do it, use pen not pencil, never use white-out, date all entries
- Accuracy relates to the true value, while precision relates to the spread or repeatability of measurements - they are independent concepts
- Uncertainty has three sources: limit of reading, device precision, and measurand variation - use whichever is greatest
- Analogue devices have limit of reading = half the smallest division; digital devices = one whole division
- Always make repeat measurements when possible to check reliability and estimate uncertainty