Phylogenetic Trees (VCE SSCE Biology): Revision Notes
Phylogenetic Trees
What is a phylogenetic tree?
Scientists estimate there are over one trillion different organisms on Earth, all related to each other to varying degrees. Phylogenetic trees provide a visual way to represent these evolutionary relationships and map out the tree of life.
Phylogenetics is the study of the evolutionary history of organisms and their relationships to other organisms, both past and present. This information can be shown using a phylogenetic tree, which is a diagram that illustrates evolutionary relationships between species.
Phylogenetic trees are particularly useful for displaying:
- The timeline of lineages (evolutionary paths)
- Relatedness between different taxa (groups of organisms)
- Shared characteristics between taxa
These visual representations help scientists understand how species evolved and how they are related to one another.
Key terminology
Before exploring phylogenetic trees in detail, it's important to understand these fundamental terms:
Phylogenetics: the study of the evolutionary history of an organism or group of organisms
Phylogenetic tree: a diagram used to illustrate evolutionary relationships between species
Evolutionary relationship: the relatedness of organisms based on shared ancestry
Lineage: a direct sequence of species that evolved from a common ancestor
Taxon (plural: taxa): a unit of biological classification into which related organisms are classified. Taxa are arranged in a hierarchical rank from kingdom down to species, where members of a specific taxon typically share certain morphological characteristics
Structure of a phylogenetic tree
Every phylogenetic tree consists of four main components: roots, branches, nodes, and leaves. Understanding these components is essential for reading and interpreting phylogenetic trees correctly.
Remembering the four components is crucial for correctly interpreting any phylogenetic tree. Use the mnemonic RBNL - Root, Branch, Node, Leaf - to help you recall all the parts.
Components of a phylogenetic tree
Root: represents the most recent common ancestor for all members of a phylogenetic tree. This appears as a line at the origin of the tree, showing where all the organisms on the tree descended from.
Branch: a line on a phylogenetic tree that represents an evolutionary path. Each line shows the continuation of a lineage over time.
Node: the splitting point between two branches on a phylogenetic tree, representing a speciation event. This is where one ancestral species diverged into two or more descendant species.
Leaf: the end of a branch that shows the current (or final) form of a species. These endpoints are labelled with species or taxa names and represent either present-day organisms or extinct species.
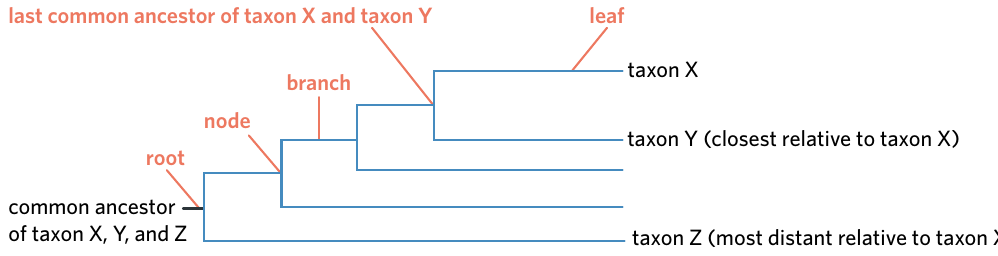
The diagram above shows how these components fit together. Notice how you can trace from any leaf backwards through the branches to find common ancestors at nodes, eventually reaching the root where all organisms share a common ancestor.
Different shapes of phylogenetic trees
Phylogenetic trees can be drawn in several different orientations, but they all represent the same evolutionary information. You might see trees drawn horizontally (like a traditional branching diagram), vertically (like a timeline going upwards), or diagonally.
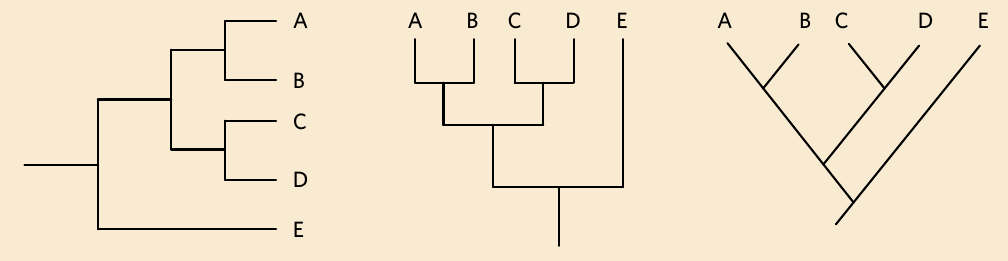
All three trees shown above contain exactly the same information about the relationships between taxa A, B, C, D, and E. The second tree is simply the first tree rotated 90 degrees. Being able to recognise and interpret these different formats is important, as exam questions may present phylogenetic trees in various orientations.
Interpreting phylogenetic trees
Reading phylogenetic trees allows you to determine evolutionary relationships between organisms and identify their closest relatives. The key skill is tracing backwards through the tree from the species you're interested in.
Key Technique: "Trace Back To Track"
Always remember to trace backwards from a species to find its relationships. The first node you encounter reveals the closest relative, and continuing back reveals more distant relatives and common ancestors.
Reading trees to find relationships
To find the closest relative to a particular species, trace backwards from that species' leaf until you reach the first node. The other species branching from that node is the closest relative.
Worked Example: Finding the Closest Relative to Humans
Using the vertebrate tree below, let's determine what is most closely related to humans:
Step 1: Start at the "humans" leaf and trace backwards through the tree.
Step 2: The first node you encounter (node A) splits humans from monkeys.
Conclusion: Monkeys are the closest relative to humans on this tree.
Additional Analysis: If you continue tracing back to the next node (node B), you find where humans and monkeys diverge from dolphins and sheep. This shows that humans are more closely related to monkeys than to dolphins and sheep.
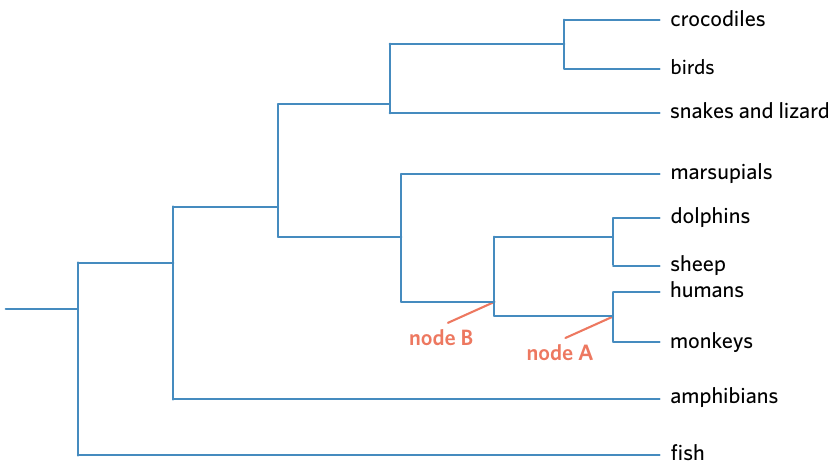
Understanding common ancestors
Every node on a phylogenetic tree represents a common ancestor. The position of the node indicates when that ancestor existed relative to other common ancestors on the tree. Nodes closer to the leaves represent more recent common ancestors, while nodes closer to the root represent more ancient common ancestors.
The most recent common ancestor of humans and monkeys exists at node A, while the most recent common ancestor of humans, monkeys, dolphins, and sheep exists at node B. The further back you trace, the more ancient the common ancestor becomes.
Using timescales on phylogenetic trees
Some phylogenetic trees include a timescale, which allows you to determine exactly when divergence events occurred. When a timescale is present, the branch length represents time.
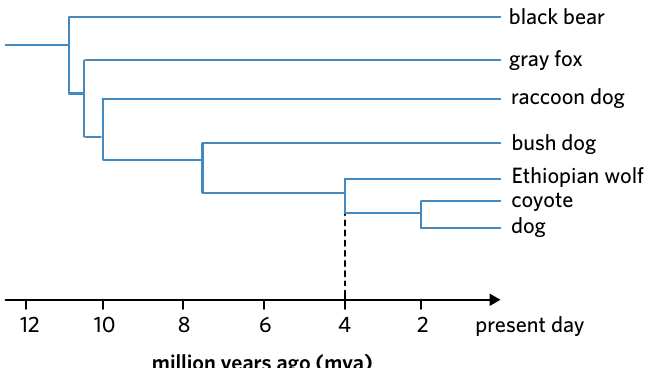
Worked Example: Reading a Timescale Tree
This tree shows the evolutionary relationships among dogs and their relatives. The horizontal axis shows time in millions of years ago (mya).
To determine when species diverged:
- Follow the branches to where they meet (the node)
- Read the time from the horizontal axis
Findings:
- Ethiopian wolves diverged from dogs approximately 4 million years ago
- Dogs and coyotes share a more recent common ancestor at around 2 million years ago
The closer the node is to the present (right side), the more recently the species diverged.
Constructing phylogenetic trees
Phylogenetic trees can be built using information about shared traits, particularly homologous structures (features inherited from a common ancestor). The construction process involves identifying which traits are shared by the largest groups of organisms.
Using trait data
Consider this example showing the presence (+) or absence (−) of particular features in different vertebrate groups:
| Trait | Bony fish | Amphibians | Marsupials | Placental mammals |
|---|---|---|---|---|
| Four legs | − | + | + | + |
| Fur | − | − | + | + |
This table shows that bony fish lack both four legs and fur, amphibians have four legs but no fur, while both marsupials and placental mammals possess both traits.
Worked Example: Constructing a Phylogenetic Tree from Trait Data
Using the trait table above, let's build a phylogenetic tree step by step:
Step 1: Identify the trait shared by the largest number of organisms
Most animals in the table have four legs, except bony fish. Therefore, draw the bony fish lineage branching off first, before the "four legs" trait evolved.
Step 2: Look for the trait shared by the second-largest number of organisms
Among the remaining animals, only amphibians lack fur. Draw the amphibians lineage branching off before the "fur" trait, but after the "four legs" trait.
Step 3: Draw the final branches
Both marsupials and placental mammals have fur, so these two lineages branch directly from the "fur" node.
Result: The tree is built from most general traits (shared by many) to most specific traits (shared by few), creating a logical evolutionary progression.
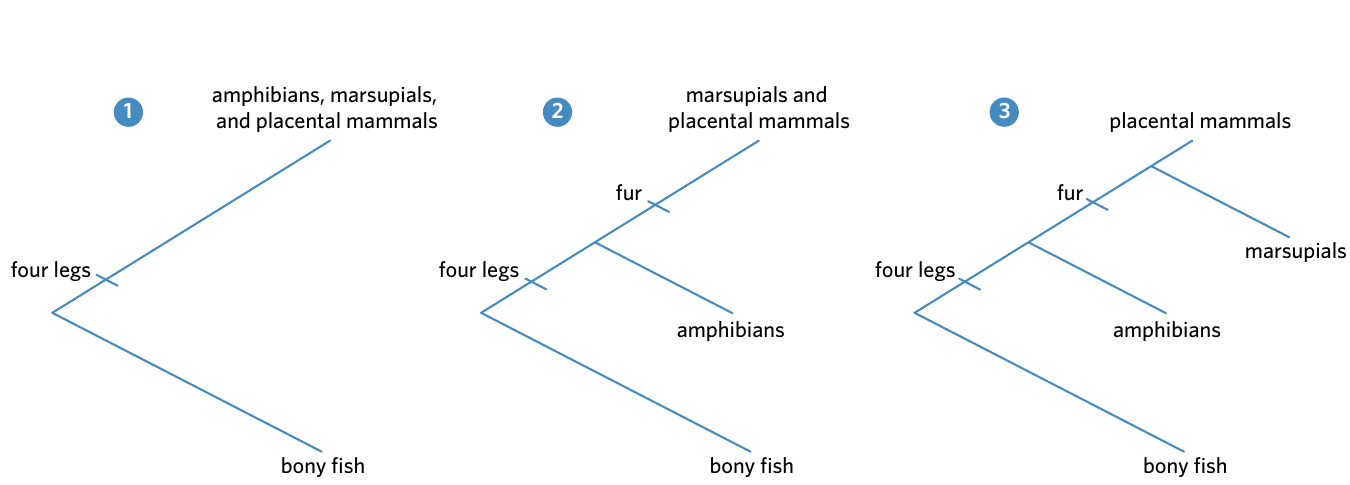
The diagram above shows the three stages of building this phylogenetic tree. Each stage adds another group of organisms based on shared traits, building up the complete tree from left to right.
Depicting uncertainties in phylogenetic trees
Fossil evidence is not always complete or perfectly preserved, and dating techniques have limitations. Phylogenetic trees can represent these uncertainties in several ways to honestly communicate gaps in our knowledge.
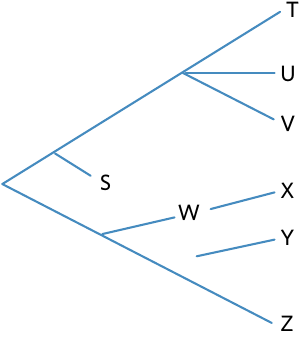
This tree shows various ways uncertainties can be depicted:
Missing nodes: The lack of a clear node between species Y and Z indicates that the exact divergence point between these species is unknown. This might occur when fossil evidence is incomplete or when the divergence happened very rapidly.
Breaks in lineages: The gap between species W and X suggests that W might be an ancestor of X, but there is no fossil evidence of transitional forms to confirm this hypothesis. These gaps represent missing links in the fossil record.
Extinct species: The branch with species S does not extend to the end of the tree, indicating this species is extinct and did not survive to the present day. Branches ending before the present time always represent extinction events.
Multiple divergences (polytomies): Sometimes a node splits into three or more branches simultaneously, as seen with species T, U, and V. This indicates uncertainty about which species diverged first. This can occur when there is insufficient data, or when multiple speciation events happened very close together in time (such as during adaptive radiation).
Adaptive radiation: the rapid divergent evolution of a species, thereby producing a wide array of species/forms
Polytomies are not necessarily "wrong" - they can represent real biological events where multiple species diverged almost simultaneously, or they can indicate that scientists need more data to resolve the branching order. Context is key to understanding what a polytomy represents.
Genetic exchange between groups
In some cases, genetic material can be exchanged between groups after they have already diverged into separate species. This is shown on phylogenetic trees using a line connecting branches.
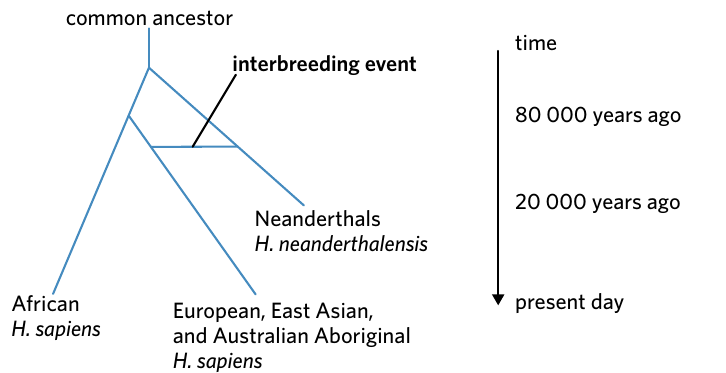
Understanding Interbreeding Events
This tree shows the relationship between modern humans (Homo sapiens) and Neanderthals (Homo neanderthalensis). The horizontal line between branches represents an interbreeding event where genetic material was exchanged between populations.
Evidence suggests that some modern human populations (European, East Asian, and Australian Aboriginal) interbred with Neanderthals, resulting in parts of their genomes being shared. This interbreeding occurred after the populations had already diverged from their common ancestor, showing that speciation is not always a one-way process.
Key Points to Remember:
-
Phylogenetic trees are diagrams that show evolutionary relationships between species based on shared ancestry. They consist of four main components: roots (common ancestors), branches (evolutionary paths), nodes (divergence points), and leaves (present-day or extinct species).
-
To find the closest relative to a species, trace backwards through the tree until you reach the first node. The other species at that node is the closest relative. Continue tracing back to find more distant relatives and common ancestors. Remember: "Trace Back To Track"!
-
Phylogenetic trees can include timescales where branch length represents time, allowing you to determine when divergence events occurred. The longer the branch, the more time has passed.
-
Trees are constructed using shared traits, starting with traits shared by the most organisms and progressively adding branches for groups with additional shared characteristics. Work from general to specific traits.
-
Uncertainties in fossil evidence can be shown through missing nodes, breaks in lineages, extinct species (branches that don't reach the present), polytomies (multiple splits), and lines between branches (interbreeding events). These features honestly represent gaps in our knowledge or real biological complexity.