Burden of Disease (VCE SSCE Health and Human Development): Revision Notes
Burden of Disease
What is burden of disease?
When health professionals want to understand the true impact of different health conditions on a population, they need to look at more than just death rates or illness rates alone. This is where burden of disease comes in.
Burden of disease is a comprehensive measure that combines both mortality (deaths) and morbidity (illness and disability) to show the total impact a condition has on society. It measures the gap between our current health status and an ideal situation where everyone lives to an old age without disease or disability.
Burden of disease statistics provide a way of examining the total burden that a condition places on society by taking into account both the impact of deaths and the impact of living with illness or disability.
Think about comparing asthma with cancer. Asthma affects many people and can last a lifetime, but it causes relatively few deaths. Cancer, on the other hand, causes thousands of deaths each year but affects fewer people overall. How can we fairly compare these two very different conditions? This is exactly the problem that burden of disease measurements solve.
Understanding DALY
The unit used to measure burden of disease is called a disability-adjusted life year, or DALY (pronounced 'dally').
One DALY represents one year of healthy life lost. This loss could be due to:
- Premature death, or
- Living with disease or disability that reduces quality of life
Worked Example: Understanding DALYs in Practice
If a population loses 1000 DALYs due to asthma, it means 1000 years of healthy life have been collectively lost through either premature deaths or people living with reduced quality of life.
If the same population loses 2000 DALYs due to mental illness, we know that mental illness has twice the burden of asthma.
In 2020, approximately 5 million years of healthy life were lost in Australia due to disease and disability.
DALYs are particularly useful because they allow us to:
- Compare different population groups
- Identify trends over time
- Determine where health interventions are most needed
- Assess the contribution of various risk factors to overall disease burden
Components of DALY
DALY is calculated by adding two components together: years of life lost (YLL) and years lost due to disability (YLD).
Years of life lost (YLL)
YLL represents the fatal component of burden of disease. Each YLL is one year of expected life lost because someone died prematurely.
YLL can be calculated for any condition that causes death. The key principle is: the younger someone is when they die, the more YLL are counted for that condition.
Worked Example: Calculating YLL
Example 1: Death at age 60
- A person who dies from cancer at age 60
- Life expectancy for a 60-year-old is 85 years
- YLL contributed: years
Example 2: Infant death
- An infant who dies before reaching age 1
- Life expectancy for a 1-year-old is around 82 years
- YLL contributed: approximately years
This is why infant deaths contribute significantly more YLL than deaths in older age groups.
Years lost due to disability (YLD)
YLD represents the non-fatal component of burden of disease. It measures healthy years of life lost due to living with disease, injury, or disability.
Calculating YLD is more complex than calculating YLL because different conditions have different levels of severity. For example:
- Alzheimer's disease generally has a greater impact on quality of life than asthma
- The calculation formula accounts for these differences in severity
Think of it this way: If someone lives with a disease for 10 years that makes them only 'half well', they have lost five years of healthy life to that condition.
YLD can occur at any stage of a person's life, though ill health generally has greater impacts towards the end of life.
Both YLL and YLD are equal in value - each represents one year of life lost. The difference is that YLL comes from premature death, while YLD comes from illness, injury, or disability.
How burden of disease changes across the lifespan
The pattern of disease burden varies significantly across different age groups, as shown by both the total burden (DALY) and the contributions of YLL and YLD.
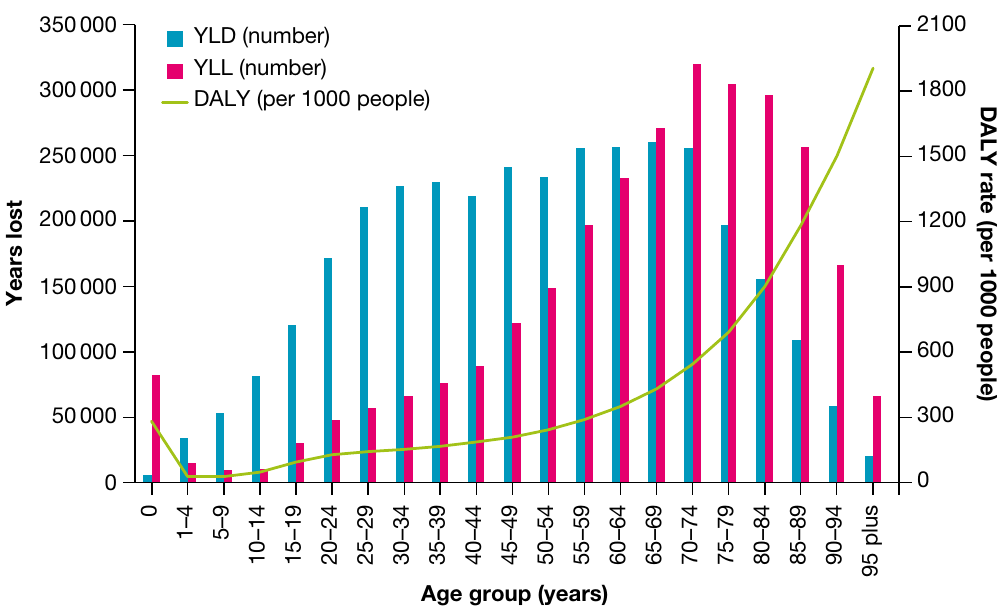
In the first year of life:
- The DALY rate is relatively high (around 300 per 1000 people)
- Infants who die contribute significant YLL because they lose so many potential years of life
In early childhood (ages 1-4):
- The burden decreases significantly to around 40 per 1000 people
- This is the lowest point across the entire lifespan
From childhood through to age 64:
- The burden gradually increases
- Most of the burden comes from non-fatal causes (YLD)
- This reflects the high number of people living with chronic illnesses during these years
From age 65 onwards:
- Fatal burden (YLL) becomes higher than non-fatal burden (YLD)
- YLL increases gradually, reaching its maximum in the 70-74 age group
- Many people die after age 74, accounting for relatively high YLL in older age groups
YLD patterns:
- YLD gradually increases from birth until around age 35-39
- It fluctuates through middle age
- Peaks in the 65-69 age group
- Then gradually decreases
For those aged 95 and over:
- The overall DALY rate reaches approximately 1900 per 1000 people
- This represents the highest burden rate across the lifespan
Burden of disease in Australia
Australia's health status is good overall, but certain diseases continue to cause significant burden. Many of these conditions are largely preventable and result from lifestyle choices, making them a focus for health interventions.
Major disease groups
In 2019, the five disease groups causing the most burden in Australia were:
Top 5 Disease Groups Contributing to Burden:
- Cancer
- Cardiovascular diseases
- Musculoskeletal disorders
- Mental and substance use disorders
- Injuries
Together, these five groups accounted for approximately 63% of the total disease burden in Australia.
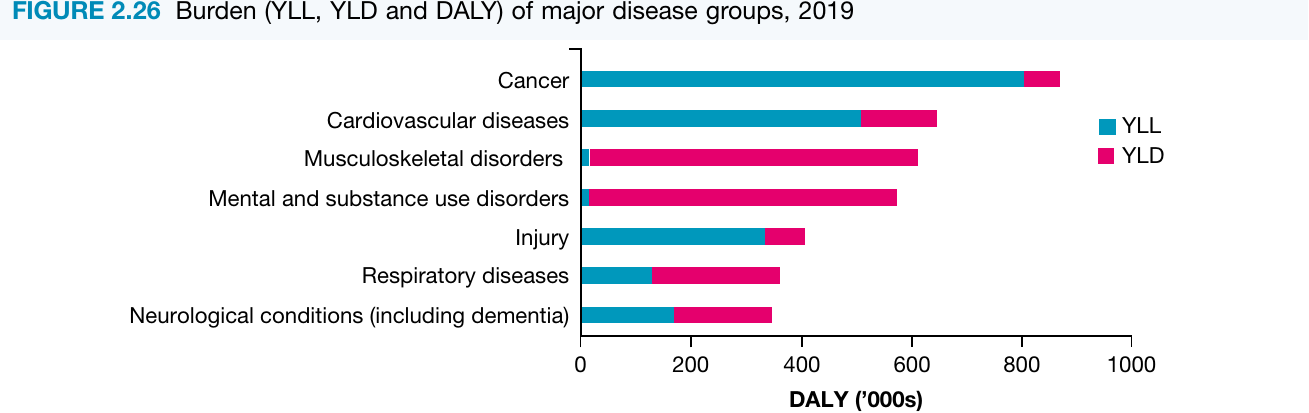
Fatal versus non-fatal burden
Different diseases contribute to burden in different ways:
Predominantly fatal burden (mostly YLL):
- Cancer shows the highest total burden, with most of it coming from premature deaths
- Cardiovascular diseases also contribute substantial fatal burden
Entirely non-fatal burden (all YLD):
- Musculoskeletal disorders (such as arthritis and back pain) cause significant burden through disability but rarely cause death
- Mental and substance use disorders similarly contribute burden primarily through reduced quality of life rather than deaths
Mixed contributions:
- Respiratory diseases show both fatal and non-fatal burden
- Neurological conditions (including dementia) have components of both
- Injuries contribute both YLL (from deaths) and YLD (from disability)
This breakdown helps health professionals understand whether interventions should focus on preventing deaths, reducing disability, or both.
Age-specific patterns in disease burden
The overall burden of disease varies across age groups, and different conditions affect different stages of life.
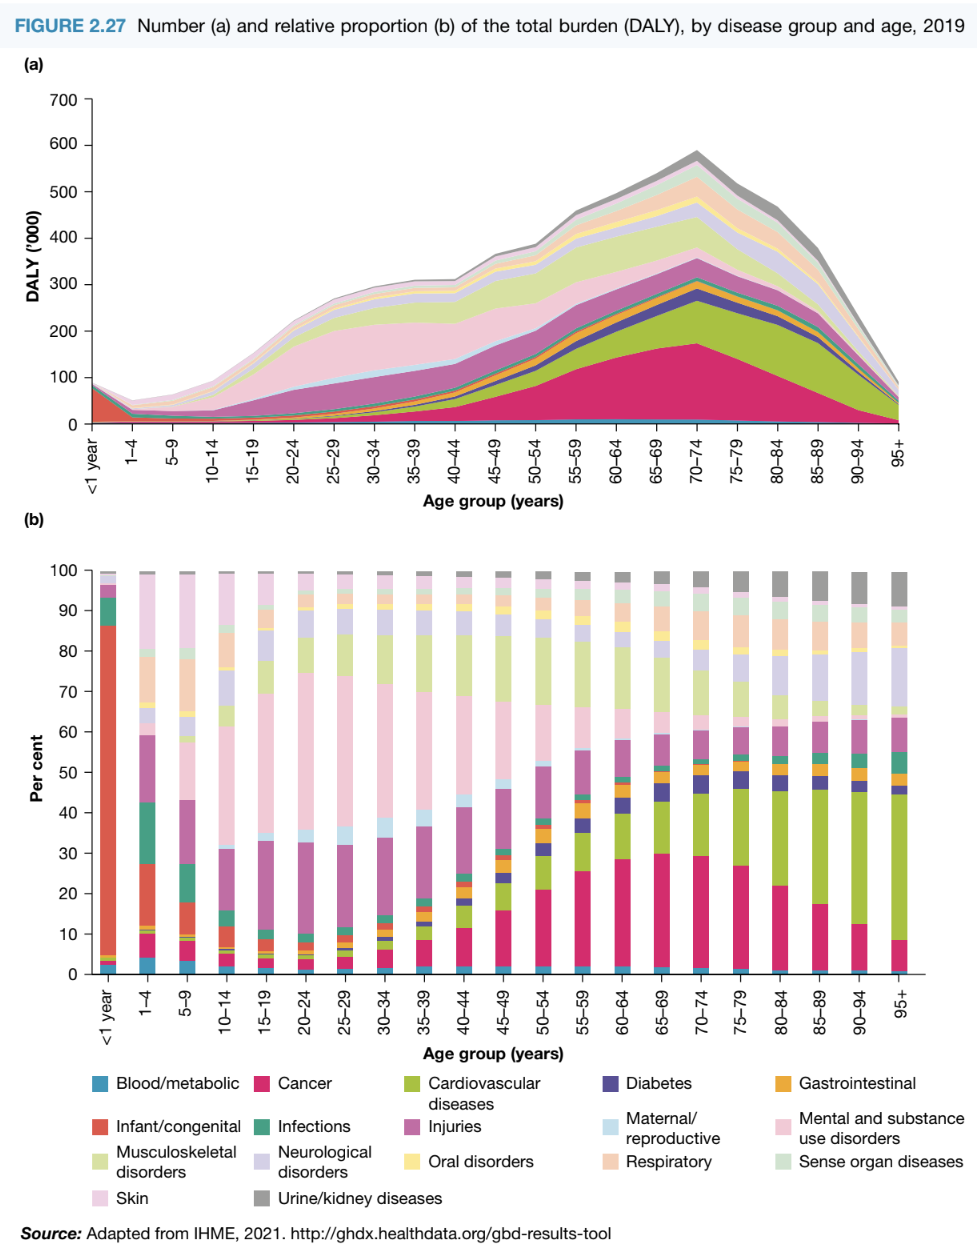
Total burden by age:
- Burden is relatively low in younger age groups
- It gradually increases with age
- The highest total burden occurs in the 60-64 age group
- After this, burden remains high but starts to decline slightly in the very oldest age groups
Which diseases affect which age groups:
Infancy (under 1 year):
- Infant and congenital conditions dominate the disease burden
- These conditions have their greatest impact in the first year of life, then decrease sharply
Children and young adults (up to age 50):
- Mental conditions and injuries account for a relatively high proportion of total burden
- These conditions are particularly significant during adolescence and young adulthood
Middle age and beyond (age 50+):
- Cancer begins to account for an increasing proportion of burden
- Cardiovascular diseases also increase substantially
- These two groups become dominant contributors to burden in older age
Older adults (age 65+):
- Cardiovascular diseases and cancer make up the largest proportion of burden
- Neurological conditions (including dementia) also contribute significantly
- The mix of conditions becomes more complex with multiple chronic diseases
This age-related pattern helps explain why different public health interventions target different age groups. For example, mental health programs often focus on young people, while cardiovascular disease prevention is emphasised for middle-aged and older adults.
Trends in burden of disease
Changes from 2003 to 2015
Australian burden of disease studies have identified several important trends:
Overall burden:
- When accounting for population growth and ageing, the rate of burden decreased by 11% between 2003 and 2015
- The rate fell from 208 to 184 DALYs per 1000 people
Fatal versus non-fatal burden:
- Non-fatal burden (YLD) remained similar: 97 per 1000 people in 2003 compared to 95 per 1000 in 2015
- Fatal burden (YLL) decreased by 20%, from 111 to 89 per 1000 people
Specific disease groups:
Most disease groups showed decreasing or stable rates. However, some conditions increased:
- Neurological conditions (including dementia)
- Urinary and kidney diseases
Non-fatal burden increases:
- Back problems
- Dementia
- Osteoarthritis
Fatal burden decreases:
- Cardiovascular diseases showed a large decrease in fatal burden

Projected trends to 2023
Based on current data, health experts have projected how the burden of certain diseases might change:
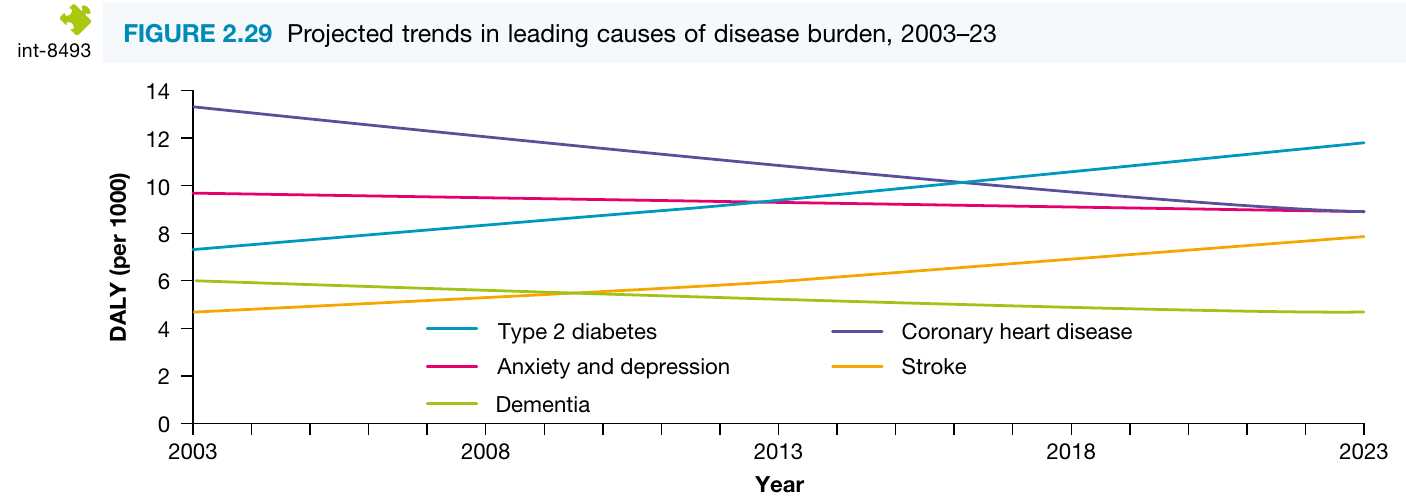
Increasing burden:
- Type 2 diabetes: Projected to show a substantial increase, overtaking coronary heart disease around 2015-2016 to become one of the leading causes of burden
- Stroke: Showing a gradual increase over the period
Decreasing burden:
- Coronary heart disease: Continuing its downward trend from 2003
Stable burden:
- Anxiety and depression: Remaining relatively stable across the period
- Dementia: Also projected to remain relatively stable to slightly decreasing
These projections are important for health planning and resource allocation. The rise in type 2 diabetes burden is particularly concerning because it is largely preventable through lifestyle changes.
Remember!
Key Points to Remember:
-
Burden of disease measures both mortality and morbidity to show the total impact health conditions have on society, measured in DALYs.
-
DALY = YLL + YLD: Disability-adjusted life years combine years of life lost to premature death (YLL) with years lost to disability (YLD). Both are equally valuable - one DALY represents one year of healthy life lost.
-
Burden changes across the lifespan: It's highest in infancy and old age. YLL dominates after age 65, while YLD is the main contributor to burden in younger and middle-aged adults.
-
The top five disease groups in Australia are cancer, cardiovascular diseases, musculoskeletal disorders, mental and substance use disorders, and injuries, accounting for about 63% of total burden.
-
Different diseases affect different age groups: Infant conditions dominate early life, mental health and injuries are significant in youth, while cancer and cardiovascular diseases increase with age.
-
Overall burden is decreasing: Australia's burden rate fell 11% from 2003 to 2015, mainly due to reduced fatal burden. However, some conditions like type 2 diabetes and dementia are increasing.