Morbidity (VCE SSCE Health and Human Development): Revision Notes
Morbidity
What is morbidity?
Morbidity measures the extent of illness and disease within a population. While mortality statistics tell us about deaths, they only reveal part of the health story. Many Australians experience conditions that significantly affect their health and wellbeing without leading to death. Even conditions that eventually cause death often create substantial illness beforehand. Understanding levels of ill health and disability is therefore essential for assessing overall health status.
Morbidity is defined as ill health in an individual and levels of ill health within a population, typically expressed through incidence and prevalence measures.
Morbidity rate measures how many people suffer from a particular condition during a given time period.
Why morbidity matters
As mortality rates have fallen and Australians live longer, morbidity rates for many conditions have increased. People are now living long enough for various factors to negatively impact their health and wellbeing. Conditions such as obesity have also become more prevalent, leading to increased rates of associated conditions like type 2 diabetes, cardiovascular disease and some cancers. Many non-life-threatening conditions, such as arthritis and osteoporosis, affect large numbers of people and significantly reduce quality of life over extended periods.
Understanding morbidity is crucial because it captures the full picture of population health. While someone may not die from arthritis or vision problems, these conditions can significantly impact daily life, require ongoing medical care, and reduce overall quality of life for many years.
Understanding incidence and prevalence
Morbidity can be measured in two important ways: incidence and prevalence. Both provide valuable information about disease burden in the population.
Incidence refers to the number (or rate) of new cases of a disease or condition in a population during a given period, usually a 12-month period. Think of incidence as measuring "new arrivals" of a disease.
Prevalence refers to the total number or proportion of cases of a particular disease or condition present in a population at a given time. Prevalence captures everyone currently living with a condition, not just those newly diagnosed.
The difference between incidence and prevalence
Unlike most infectious diseases, many chronic conditions such as cardiovascular disease and cancer are long-lasting and may never be completely cured. People generally receive a diagnosis for these conditions only once, representing their "incident year". However, because these conditions persist over time, prevalence data becomes particularly important.
Key Distinction:
Prevalence data provides crucial information about the total healthcare resources required to treat all people experiencing particular conditions at any given time. This helps health services plan for the care needs of the entire affected population, not just newly diagnosed individuals.
Understanding the Difference: A Practical Example
Imagine a school with 1,000 students:
- At the start of the year, 50 students have asthma (prevalence = 50 students)
- During the year, 10 new students are diagnosed with asthma (incidence = 10 new cases)
- By year end, prevalence = 60 students with asthma
Why both measures matter:
- Incidence helps track whether asthma diagnoses are increasing or decreasing
- Prevalence tells the school nurse how many inhalers and asthma action plans are needed
Morbidity in Australia
According to the Australian Institute of Health and Welfare, around 75 per cent of Australians experience a long-term health condition. The proportion of people experiencing one or more long-term conditions increases with age.
Common health conditions
Morbidity includes diseases, injuries and disabilities that affect Australians' health and wellbeing.

Long-term health conditions include both chronic diseases (like diabetes and heart disease) and ongoing conditions that may not be life-threatening but require management (like vision problems and hay fever). Injuries, such as the broken arm shown above, also contribute to morbidity statistics when they require ongoing care or cause lasting disability.
Most common long-term conditions by gender
The following table shows the most commonly reported long-term conditions in Australia during 2017-18, broken down by gender:
| Condition | Males (%) | Males Rank | Females (%) | Females Rank |
|---|---|---|---|---|
| Long-sighted | 27.4 | 1 | 32.0 | 1 |
| Short-sighted | 22.5 | 2 | 29.7 | 2 |
| Hay fever and allergic rhinitis | 18.9 | 3 | 19.7 | 3 |
| Back problems | 16.5 | 4 | 16.3 | 4 |
| Deafness | 12.8 | 5 | 8.0 | 12 |
| Anxiety-related disorders | 10.6 | 8 | 15.7 | 5 |
| Hypertension | 10.5 | 6 | 10.7 | 10 |
| Asthma | 10.2 | 7 | 12.3 | 7 |
| Depression and mood disorders | 9.5 | 9 | 12.0 | 8 |
| Allergies | 9.4 | 10 | 15.1 | 6 |
| Osteoarthritis | 6.8 | 12 | 11.2 | 9 |
Key observations:
- Vision problems (long-sightedness and short-sightedness) are the most common conditions for both genders
- Females have higher rates of most conditions, particularly anxiety-related disorders and allergies
- Males experience higher rates of deafness
- Many of these conditions do not contribute to death but may significantly reduce quality of life over long periods

Morbidity patterns across the lifespan
Morbidity figures represent a snapshot of the entire population. Because Australians are living longer than ever, some conditions are very common in older populations but virtually non-existent in younger groups. Examining the most reported long-term conditions for different age groups helps government and non-government organisations develop appropriate strategies and allocate funding to address the most prevalent conditions in each age bracket.
The table below shows the five most common conditions for each age group in 2017-18:
| Age Group | Condition | Per cent |
|---|---|---|
| 0-14 | Mental and behavioural problems | 11.1 |
| Asthma | 10.1 | |
| Hay fever | 10.0 | |
| Food allergy | 5.5 | |
| Short-sightedness | 4.5 | |
| 15-24 | Mental and behavioural problems | 25.6 |
| Hay fever and allergic rhinitis | 21.4 | |
| Short-sightedness | 19.4 | |
| Long-sightedness | 12.9 | |
| Asthma | 10.2 | |
| 25-34 | Short-sightedness | 25.9 |
| Hay fever and allergic rhinitis | 22.8 | |
| Mental and behavioural problems | 21.2 | |
| Back problems | 14.6 | |
| Asthma | 10.7 | |
| 35-44 | Short-sightedness | 25.6 |
| Hay fever and allergic rhinitis | 23.8 | |
| Back problems | 20.9 | |
| Mental and behavioural problems | 20.6 | |
| Long-sightedness | 17.3 | |
| 45-54 | Long-sightedness | 53.2 |
| Short-sightedness | 34.2 | |
| Mental and behavioural problems | 23.8 | |
| Hay fever and allergic rhinitis | 22.5 | |
| Back problems | 23.2 | |
| 55-64 | Long-sightedness | 62.1 |
| Short-sightedness | 41.9 | |
| Arthritis | 34.0 | |
| Cardiovascular disease | 31.9 | |
| Back problems | 28.0 | |
| 65+ | Long-sightedness | 61.7 |
| Arthritis | 49.0 | |
| Short-sightedness | 40.7 | |
| Endocrine diseases including diabetes | 39.1 |
Notable Patterns Across the Lifespan:
- Mental and behavioural problems are most common in children and young adults (ages 0-24), with rates reaching 25.6% in the 15-24 age group
- Vision problems become increasingly common with age, with long-sightedness affecting over 60% of people aged 55 and older
- Chronic conditions emerge in older age groups: arthritis, cardiovascular disease and diabetes become prominent from age 55 onwards
- Hay fever and allergic conditions affect many younger Australians across multiple age groups
- Back problems emerge as significant from age 25 onwards, affecting approximately 15-28% of adults
Healthcare utilisation: morbidity requiring care
Illnesses and disabilities vary in severity, and many people require professional care to improve their health and wellbeing. Morbidity data from doctors and hospitals provides valuable insights into health status and healthcare needs.
GP visits
According to Department of Health data from 2020, around 163 million visits to general practitioners (GPs) were made in 2019-20, which equals approximately 6.5 visits per person each year. Females are more likely to visit doctors than males, though this doesn't necessarily mean they experience more illness—it may reflect greater willingness to seek medical care when symptoms or concerns arise.
GP visits often involve multiple interventions including prescribing medicines, ordering pathology tests (such as urine and blood tests), administering vaccinations, and discussing test results.
The gender difference in GP visits is interesting: while females visit doctors more frequently, this doesn't necessarily indicate worse health. Research suggests females may be more proactive about preventative care and more willing to seek help for symptoms early, which could actually lead to better health outcomes in the long term.
Common reasons for GP visits
The table below shows the principal reasons Australians visited their GP in 2015-16:
| Principal reason | Percentage of visits |
|---|---|
| Prescription | 8.8 |
| Check-up | 8.1 |
| Test results | 6.7 |
| Cough | 4.1 |
| Immunisation/vaccination | 3.3 |
| Administrative procedure | 2.5 |
| Back complaint | 2.0 |
| Rash | 1.8 |
| Throat symptom/complaint | 1.8 |
| Blood test | 1.5 |
| Fever | 1.4 |
| Depression | 1.3 |
| Abdominal pain | 1.2 |
| Upper respiratory tract infection | 1.1 |
| Headache | 1.1 |
| Skin symptom/complaint | 1.1 |
| Sneezing/nasal congestion | 1.0 |
| Hypertension/high blood pressure | 1.0 |
| Anxiety | 1.0 |
| All other reasons | 49.2 |
COVID-19 Impact on GP Visits:
The 2020 report "General Practice: Health of the Nation 2020" revealed the significant impact of COVID-19 on GP visiting patterns:
- Psychological concerns (64%) became the top reason for GP visits
- Preventative care (56%) moved to second place
- Respiratory causes (45%) became the third most common reason
This dramatic shift shows how major health events can rapidly change healthcare utilisation patterns.
Hospital care
Hospital care encompasses treatment for chronic conditions (where patients are admitted to receive ongoing care) and emergency care for unforeseen events requiring medical intervention, such as car accidents, sporting injuries and premature births.
In 2018-19, there were 11.5 million hospitalisations in Australia, with approximately 60 per cent occurring in public hospitals and 40 per cent in private hospitals.
Hospital separation refers to episodes of hospital care that start with admission and end at transfer, discharge or death. This measure helps track the volume and types of hospital care provided.
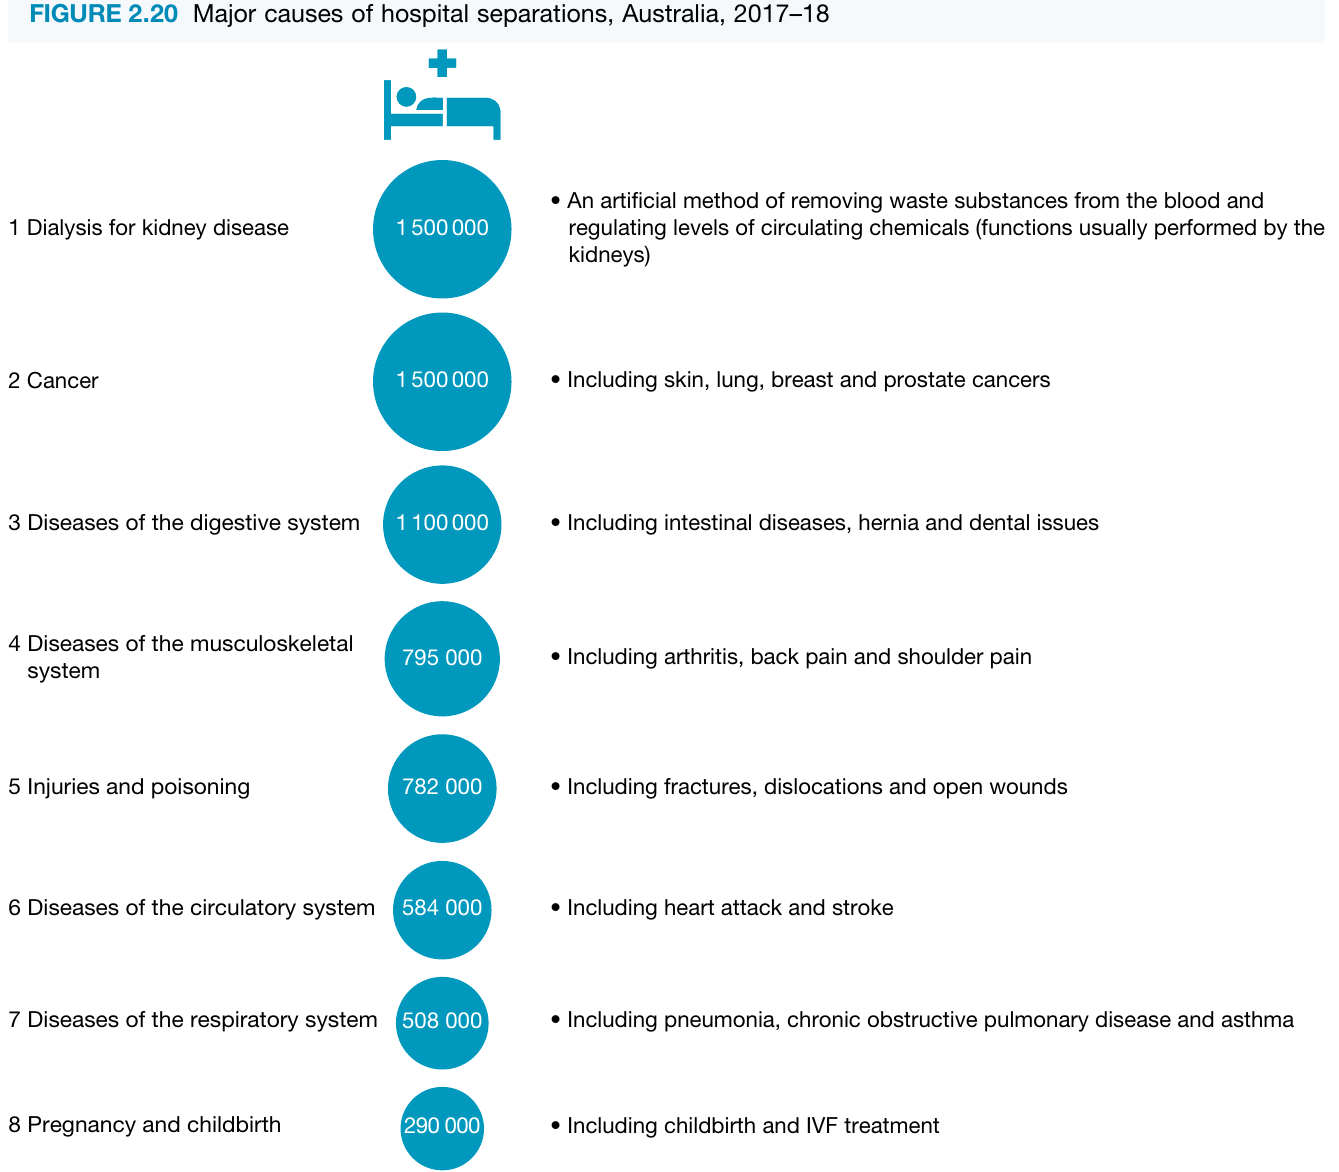
The major causes of hospital separations in 2017-18 were:
- Dialysis for kidney disease (1,500,000 separations) - An artificial method of removing waste substances from the blood and regulating levels of circulating chemicals, functions usually performed by the kidneys
- Cancer (1,500,000 separations) - Including skin, lung, breast and prostate cancers
- Diseases of the digestive system (1,100,000 separations) - Including intestinal diseases, hernia and dental issues
- Diseases of the musculoskeletal system (795,000 separations) - Including arthritis, back pain and shoulder pain
- Injuries and poisoning (782,000 separations) - Including fractures, dislocations and open wounds
- Diseases of the circulatory system (584,000 separations) - Including heart attack and stroke
- Diseases of the respiratory system (508,000 separations) - Including pneumonia, chronic obstructive pulmonary disease and asthma
- Pregnancy and childbirth (290,000 separations) - Including childbirth and IVF treatment
Notice that dialysis and cancer together account for 3 million separations - more than a quarter of all hospital care. This reflects both the serious nature of these conditions and the ongoing, regular treatment many patients require. Many dialysis patients need treatment multiple times per week, which explains why kidney disease generates the highest number of separations.
Trends in morbidity
Several important morbidity trends are emerging in Australia. While the long-term effects of some trends on future mortality and morbidity rates take time to become apparent, current patterns are worth noting. Key trends identified by the Australian Institute of Health and Welfare include:
- Significant increase in overweight and obesity prevalence over the past 20-30 years
- Increased rates of impaired glucose regulation (a precursor to type 2 diabetes) since 1980
- Tripled rates of diabetes in the past two decades
- Increased rates of kidney disease, attributed to the increased rates of diabetes
Overweight and obesity trends
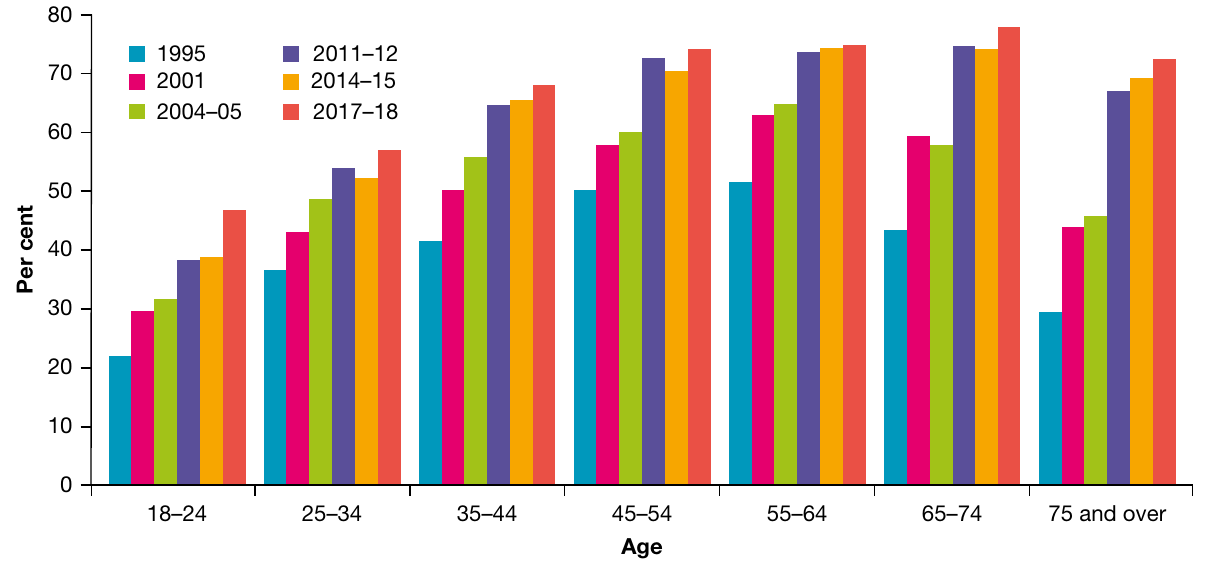
The graph above shows clear trends in overweight and obesity prevalence from 1995 to 2017-18:
- All age groups have experienced increases in overweight and obesity rates
- The increases have occurred consistently across the entire time period
- Older age groups (45-54, 55-64, 65-74, and 75+) show the highest rates, with approximately 70-75% affected by 2017-18
- Even the youngest adult age group (18-24) has seen rates climb from around 20% in 1995 to nearly 50% by 2017-18
- Middle-aged groups (45-64) show particularly high rates, approaching 75% in recent years
Why These Trends Matter:
These trends are concerning because overweight and obesity are risk factors for numerous other conditions, including:
- Type 2 diabetes
- Cardiovascular disease
- Some cancers
- Joint problems and arthritis
- Sleep apnoea
As these trends continue, they are likely to contribute to further increases in related chronic conditions. This creates a compounding effect on the healthcare system, as treating obesity-related conditions requires substantial resources and long-term care.
The data shows this is not just affecting one generation - rates are increasing across all age groups, suggesting this is a population-wide challenge that will require comprehensive, long-term solutions.
Key Points to Remember:
-
Morbidity measures ill health in populations, including diseases, injuries and disabilities that don't necessarily cause death but significantly impact quality of life.
-
Two key measures: Incidence counts new cases of a condition during a specific period (like "new arrivals"), while prevalence counts all existing cases at a given time (everyone currently affected). Both measures are important for understanding disease burden and planning healthcare services.
-
About 75% of Australians have a long-term health condition, with vision problems, hay fever, back problems and mental health conditions being most common. Patterns vary significantly by age and gender.
-
Healthcare utilisation is substantial: Australians average 6.5 GP visits per year (163 million total), and there are over 11 million hospital separations annually. Major causes of hospitalisation include dialysis, cancer treatment, digestive system diseases and musculoskeletal conditions.
-
Overweight and obesity rates have increased dramatically over the past 20-30 years across all age groups, contributing to rising rates of diabetes (tripled in two decades) and kidney disease. This trend is one of the most significant morbidity challenges facing Australia.