Mortality (VCE SSCE Health and Human Development): Revision Notes
Mortality
Understanding mortality and mortality rates
Mortality refers to the total number of deaths that occur in a population during a specific time period, typically measured over 12 months. This measure helps us understand how many people are dying in a population and from what causes.
The mortality rate (also called the death rate) tells us the proportion of a population that dies within a year. Rather than just counting total deaths, the mortality rate expresses deaths per 1,000 or per 100,000 people. This standardisation allows fair comparisons between different population groups and countries of varying sizes.
Worked Example: Understanding Mortality Rates
If a population of one million people has a cancer mortality rate of 50 per 100,000, we can calculate the actual number of deaths:
Step 1: Set up the calculation
Step 2: Solve
Therefore, approximately 500 people would die from cancer in that year.
By expressing data this way, we can compare mortality between small towns and large cities, or between different countries.
Exam tip: Always include the correct unit of measurement when discussing mortality data. A rate of 50 per 1,000 is very different from 50 per 100,000. Using the wrong unit will make your analysis factually incorrect.
Tracking mortality data over time reveals important trends. These patterns help governments and health organisations identify which conditions need urgent attention and guide funding decisions for interventions aimed at reducing deaths from leading causes.
Current mortality rates in Australia
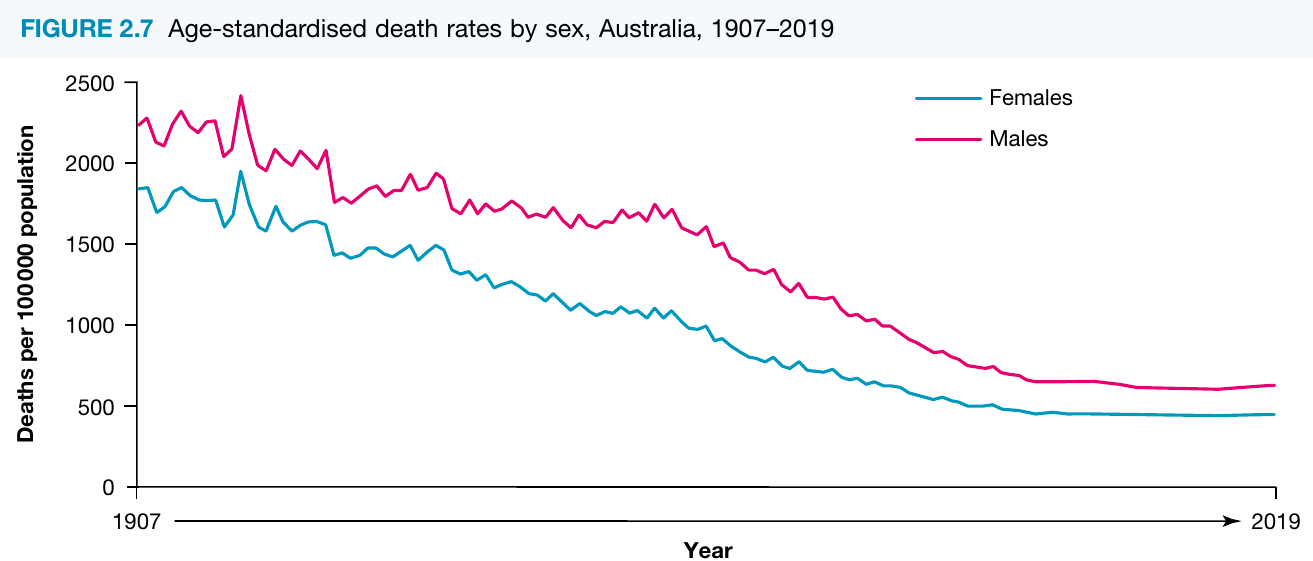
In 2019, Australia's mortality rates showed a clear gender difference:
- Males: 626 deaths per 100,000 population
- Females: 442 deaths per 100,000 population
This means males were 1.4 times more likely to die than females. For every 100,000 males in Australia, 626 died, compared to 442 deaths per 100,000 females.
Long-term mortality trends
Despite Australia's growing population and increasing total number of deaths, mortality rates per 100,000 people have fallen dramatically over the past century. Between 1907 and 2019, age-standardised death rates declined by:
- Males: 73% reduction
- Females: 77% reduction
What are age-standardised rates?
Age-standardised rates allow us to fairly compare populations with different age structures. Since Australia's population is ageing, we would naturally expect more deaths than countries with younger populations (as older people are more likely to die). Age standardisation adjusts the data to account for these differences in age distribution, making comparisons more accurate and meaningful.
Changes in leading causes of death
The leading causes of death in Australia have transformed dramatically over the past century. Advances in the economy, technology, and education have virtually eliminated many diseases that were common killers 100 years ago. Conditions like influenza and tuberculosis, which caused significant mortality in 1907, now cause relatively few deaths.
This progress has extended life expectancy and given most Australians the opportunity to live healthier, longer lives. However, as people live longer, they become more susceptible to lifestyle-related conditions.
Comparing 1907 and 2019
The following table shows how the five leading causes of death have changed their ranking and contribution to overall mortality:
| Cause | 1907 % of deaths | 1907 rank | 2019 % of deaths | 2019 rank |
|---|---|---|---|---|
| Cardiovascular diseases | 20.0 | 1 | 25.5 | 2 |
| Respiratory diseases | 14.3 | 2 | 9.6 | 3 |
| Infectious diseases | 12.6 | 3 | 1.5 | 5 |
| Cancer | 7.8 | 4 | 29.5 | 1 |
| Injury and poisoning | 4.9 | 5 | 7.0 | 4 |
| Other | 40.3 | - | 26.9 | - |
Key observations:
- Cancer has risen from fourth place (7.8%) to become the leading cause of death (29.5%)
- Infectious diseases have dropped from third place to fifth, with a dramatic decline from 12.6% to just 1.5%
- Cardiovascular diseases remain a major cause but have moved from first to second place

Although obesity was not a significant contributor to ill health 100 years ago, it now plays a major role in Australia's mortality patterns, contributing to cardiovascular disease, cancer, and other lifestyle-related conditions.
Leading causes of death in 2019
The specific leading causes of death differ slightly between males and females. When analysing these figures, remember they represent all deaths across all ages. Since older Australians account for the majority of deaths, these statistics predominantly reflect conditions affecting elderly populations.
Top 5 causes of death in 2019:
1. Coronary heart disease
Occurs when blood vessels supplying oxygen to the heart become damaged or blocked. A heart attack happens when a vessel becomes completely blocked.
- Males: 10,822 deaths
- Females: 7,422 deaths
2. Dementia and Alzheimer's disease
An umbrella term covering over 100 conditions characterised by progressive, irreversible loss of brain function. Affects memory, language, speech, attention, and personality. As brain cells die, dementia leads to complete dependency and ultimately death.
- Males: 5,424 deaths
- Females: 9,592 deaths
3. Cerebrovascular disease (including stroke)
Occurs when blood vessels feeding the brain with oxygen become damaged or blocked. A stroke happens when a vessel becomes completely blocked.
- Males: 4,089 deaths
- Females: 5,802 deaths
4. Lung cancer
Caused by uncontrolled growth of abnormal cells in the lungs. These cells can prevent healthy cells from transferring oxygen to blood.
- Males: 5,188 deaths
- Females: 3,625 deaths
5. Chronic obstructive pulmonary disease (COPD)
An umbrella term for conditions that restrict airways and make breathing difficult. The two most common forms are emphysema and bronchitis.
- Males: 4,242 deaths
- Females: 4,130 deaths
Key trends in mortality
The Australian Institute of Health and Welfare (AIHW) has identified several important mortality trends:
Major improvements:
- Infectious diseases: 95% reduction in death rates (from around 140 per 100,000 in the early 1920s to 7.6 per 100,000 in 2018)
- Colorectal cancer: Approximately 40% decline in mortality rates since the 1980s
- Cervical cancer: About 75% reduction in deaths since the 1960s
- Motor vehicle accidents: Almost 80% decrease in deaths since the 1970s
- Heart attacks: Falling rates with improved survival
- General improvements: Declining mortality rates for cancer, cardiovascular disease, strokes, injury, and asthma

Safety innovations like airbags and seatbelts have significantly contributed to the dramatic reduction in motor vehicle accident deaths over recent decades.
Areas of concern:
- Dementia: Mortality rates have increased by around 75% since 2000
- Type 2 diabetes: Rising prevalence, with rates doubling in the past 20 years
Gender-specific trends in lung cancer:
- Males: Mortality rates remain higher than females but have fallen steadily since the 1980s
- Females: Mortality rates have risen steadily since the 1960s, reflecting historical changes in smoking patterns
Specific mortality measures
Beyond general population mortality, three specialised measures help us understand deaths in vulnerable groups: infants, young children, and mothers.
Infant mortality rate
The infant mortality rate measures deaths of babies before their first birthday, usually expressed per 1,000 live births. This rate serves as a key indicator of a population's overall health and wellbeing, reflecting the social and economic resources available.
Infants depend entirely on others for food, water, shelter, and healthcare. Their developing immune and body systems make them particularly vulnerable to premature death. Therefore, infant mortality rates reveal a society's capacity to provide essential resources for sustaining human life.
Trends in infant mortality
Australia's infant mortality rates are low compared to most countries worldwide. Over time, rates have decreased for both sexes, and the gap between male and female infant mortality has narrowed.
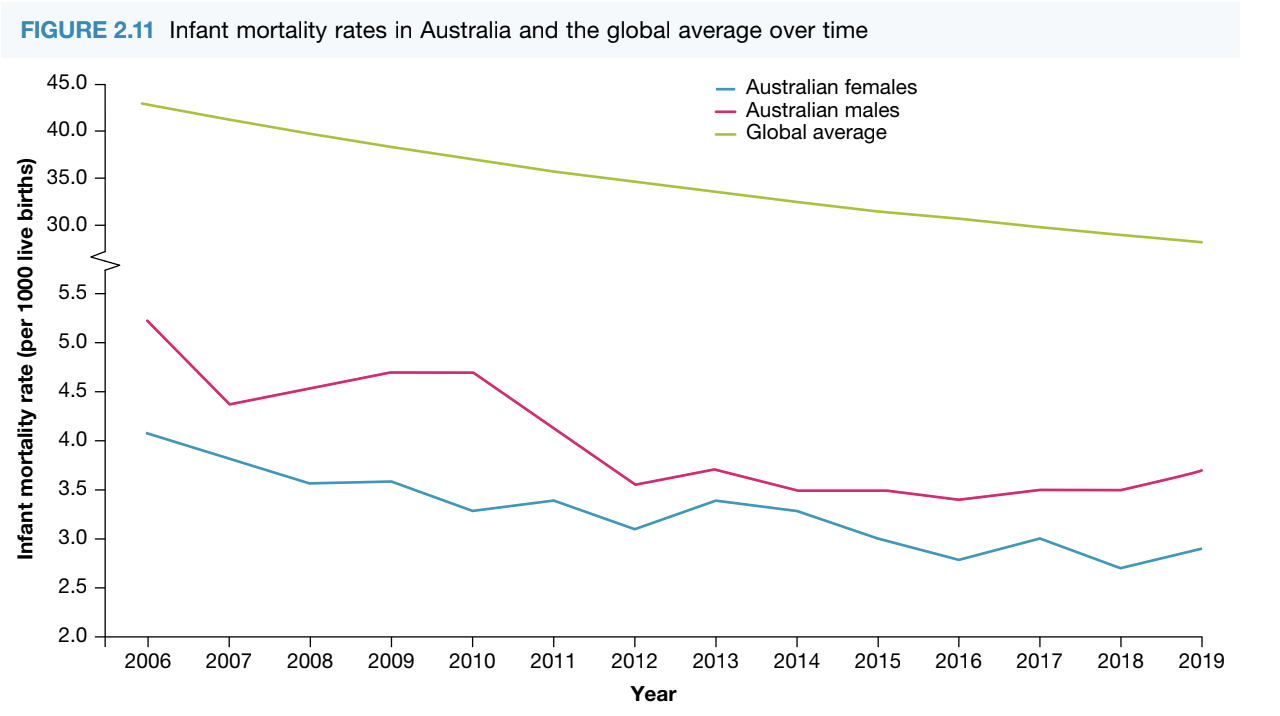
Key observations from the graph:
- Australian infant mortality rates (around 2.7-3.6 per 1,000 live births) are significantly lower than the global average (approximately 28-37 per 1,000 live births)
- Steady decline in infant mortality from 2006 to 2019
- Males consistently experience slightly higher infant mortality than females
- All three lines (Australian males, Australian females, and global average) show downward trends

Regular infant health examinations help detect and prevent conditions that could lead to infant mortality.
Causes of infant mortality
Most infant deaths stem from problems occurring during pregnancy or birth itself. Consequently, the majority of infant deaths happen in the period immediately following birth. As infants grow older, their risk of death decreases.
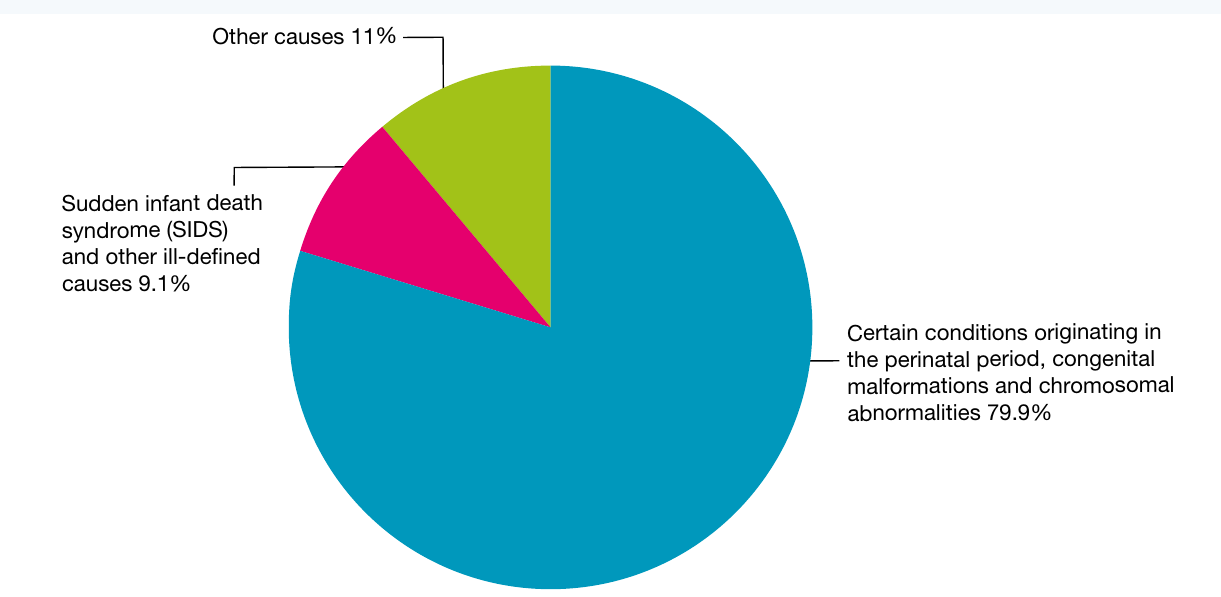
The pie chart reveals that infant deaths in Australia (2016-18) were primarily caused by:
1. Conditions originating in the perinatal period, congenital malformations, and chromosomal abnormalities (79.9%)
Perinatal conditions relate to deaths occurring in the first 28 days of life, including:
- Complications of the placenta or umbilical cord
- Infections
- Birth injuries
- Asphyxia (interrupted breathing leading to low oxygen levels, unconsciousness, and often death)
- Problems related to premature births
Congenital malformations (sometimes called 'birth defects') involve missing or ill-formed body structures. These may have genetic, infectious, or environmental origins, though in most cases the exact cause is difficult to identify.
Chromosomal abnormalities occur during the creation of sperm and ova, often involving too many or too few chromosomes. Some abnormalities lead to physical defects resulting in death.
2. Sudden infant death syndrome (SIDS) and other ill-defined causes (9.1%)
SIDS is the unexplained death of an apparently healthy infant. It's only diagnosed after all other possible causes have been ruled out. While the exact causes remain unknown, several risk factors increase SIDS likelihood:
- Being male (70% of SIDS deaths typically involve males)
- Sleeping on the stomach
Much of the decrease in infant mortality has resulted from successful campaigns to reduce SIDS deaths.
3. Other causes (11%)
Under-five mortality rate (U5MR)
The under-five mortality rate measures deaths of children before their fifth birthday, usually expressed per 1,000 live births. Like infant mortality, this rate indicates a population's general health status and available resources.
Trends in under-five mortality
The U5MR has declined steadily in Australia over time and remains low compared to most countries.
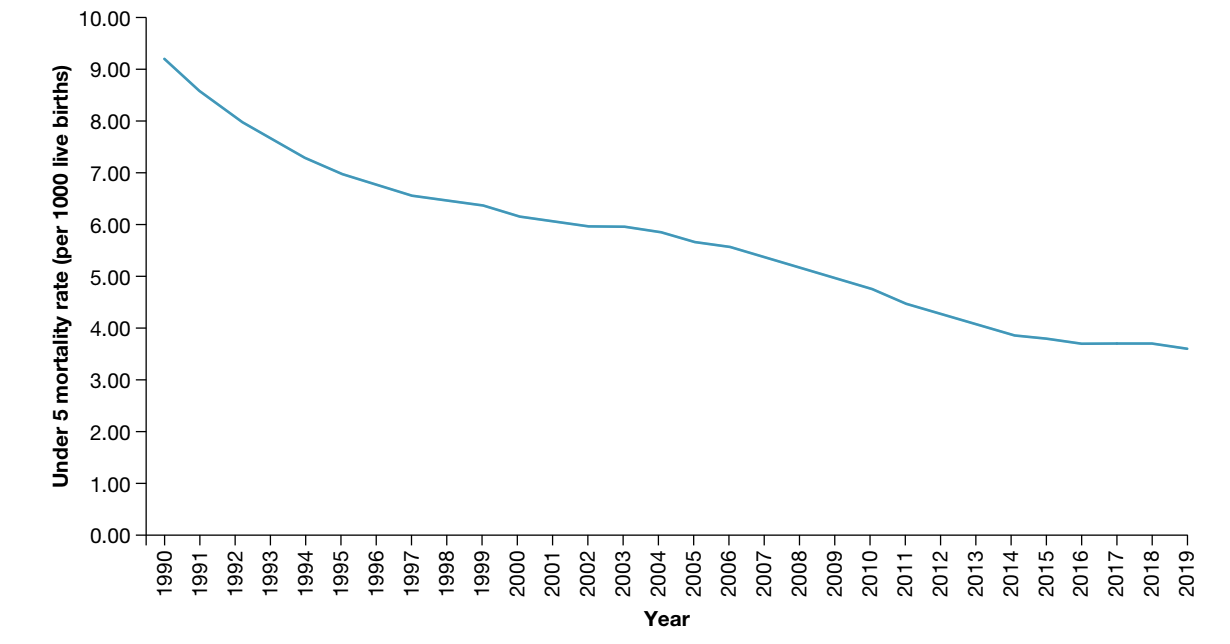
The graph shows a sharp decline from approximately 9.2 deaths per 1,000 live births in 1990 to around 3.6 per 1,000 in 2019. The steepest decline occurred in the early 1990s, with the rate of decline gradually slowing in recent years.
Contributing factors to this decline include:
- Reductions in infant mortality
- Greater awareness of risk factors for illness and injury
- National childhood vaccination programmes
- Improved health services and technology
Disparities in under-five mortality
Despite overall improvements, mortality rates remain higher for:
- Aboriginal and Torres Strait Islander children
- Children living outside major cities
- Children from low socioeconomic backgrounds
Causes of death in children aged 1-4
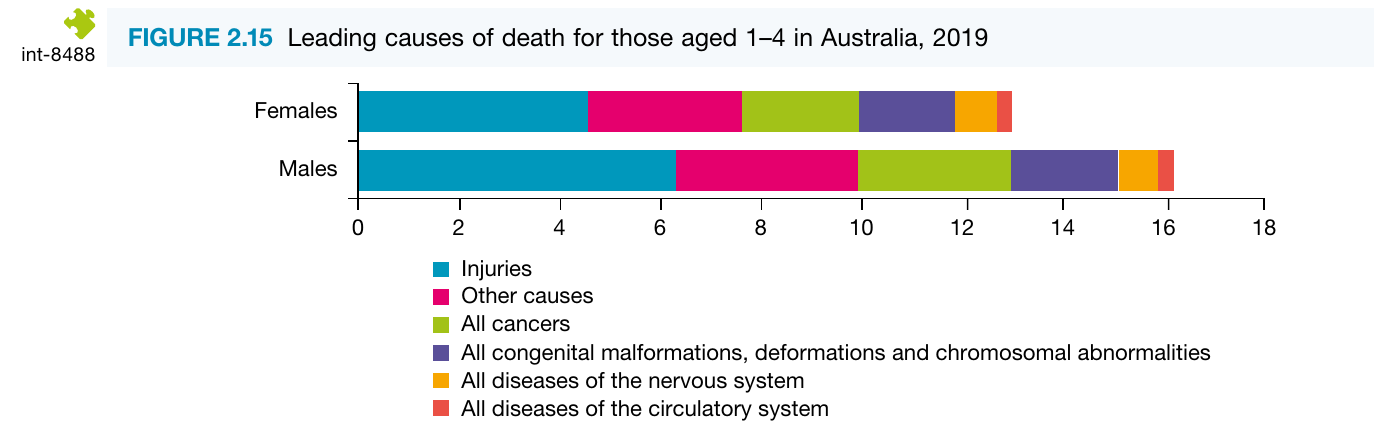
Injuries form the largest category of deaths for children aged 1-4. These are typically accidental in nature and include:
- Falls
- Drowning
- Suffocation
- Poisoning
- Transport accidents
- Burns
Other significant causes include:
- All congenital malformations, deformations, and chromosomal abnormalities
- All cancers
- Diseases of the nervous system
- Diseases of the circulatory system
- Other causes
Males experience higher mortality rates than females across most categories.
Maternal mortality ratio
Maternal mortality refers to deaths of mothers during pregnancy, childbirth, or within six weeks of delivery. The maternal mortality ratio (or rate) measures the number of mothers who die from pregnancy, childbirth, or associated treatment, usually expressed per 100,000 women who give birth (or per 100,000 live births).
Importance of maternal mortality data
Analysing maternal mortality rates allows health authorities to identify trends and implement interventions to reduce pregnancy and childbirth-related deaths.
Trends in maternal mortality
Australia experiences low maternal mortality rates compared to most countries. However, significant disparities exist within the population:
Aboriginal and Torres Strait Islander mothers face a maternal mortality ratio three times higher than the general population.
Although maternal deaths are relatively rare in Australia, both the number and rate fluctuate over time.
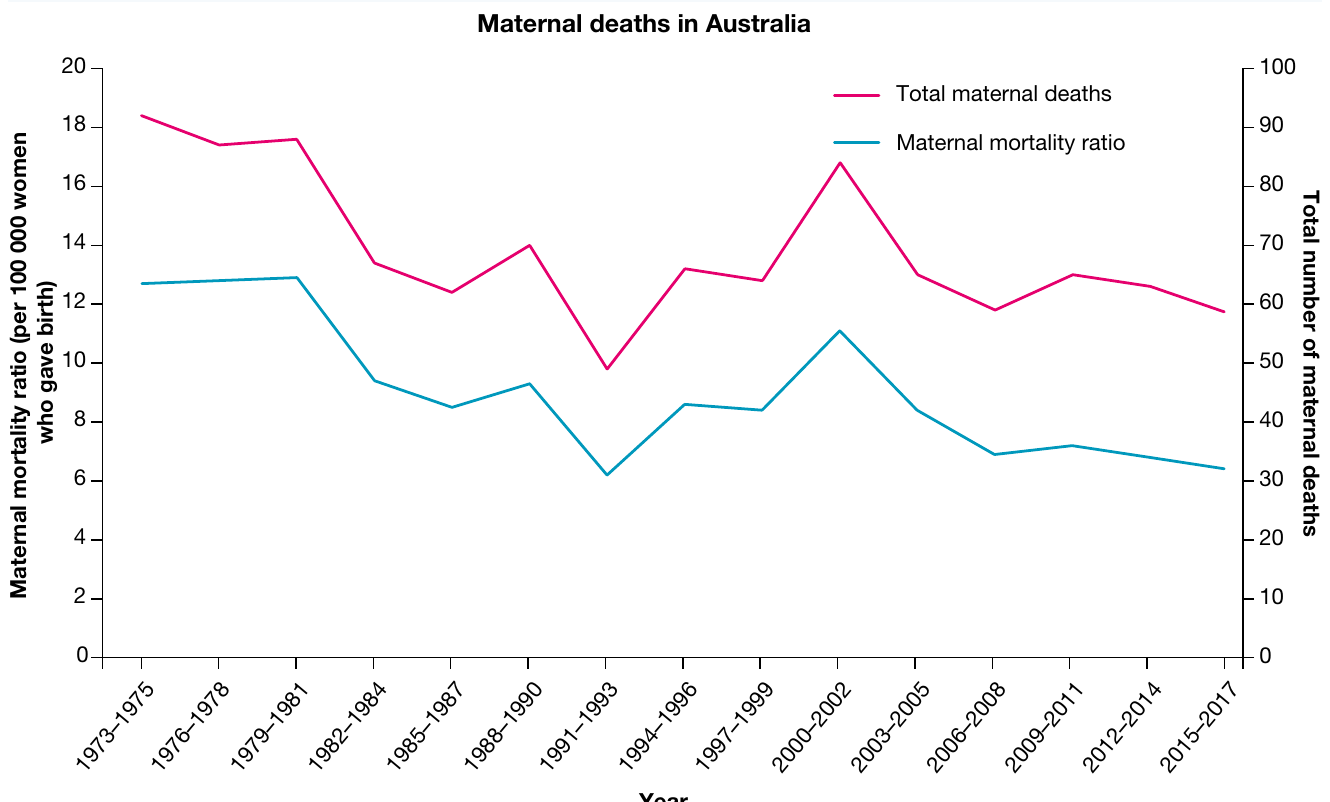
Key observations from the graph:
- Fluctuation in both total maternal deaths (purple line) and maternal mortality ratio (teal line) from 1973-2017
- A notable spike in total deaths around 2000-2002 (approximately 82 deaths)
- Overall declining trend in maternal mortality ratio from about 13 per 100,000 to around 6 per 100,000
- Recent years (2012-2017) showing relative stability at lower levels
Factors contributing to changes
Several factors influence maternal mortality trends:
- Technological developments in obstetric care
- Improvements in identifying and reporting maternal deaths
- Increasing obesity rates (contributing to higher cardiovascular disease rates among pregnant women)
- Increases in the average age of women giving birth
Leading causes of maternal mortality
1. Cardiovascular disease
Pregnancy places increased demands on the heart and blood vessels. These demands can contribute to cardiovascular diseases that weren't present before pregnancy. Cardiovascular disease is now the most common cause of maternal death in Australia.
2. Obstetric haemorrhage
Heavy bleeding during pregnancy, labour, or after birth can lead to maternal death. Obstetric haemorrhage refers specifically to excessive bleeding occurring as a result of pregnancy or childbirth.
Key Points to Remember:
-
Mortality rates have fallen dramatically: Australia has seen a 73% reduction in male mortality and 77% reduction in female mortality between 1907 and 2019
-
Cancer is now the leading cause of death: It has risen from 7.8% of deaths in 1907 to 29.5% in 2019, while infectious diseases have dropped from 12.6% to just 1.5%
-
Males have higher mortality rates: In 2019, males were 1.4 times more likely to die than females (626 vs 442 per 100,000)
-
Infant and child deaths are preventable: Most deaths in these age groups result from conditions related to birth complications, congenital abnormalities, or preventable injuries
-
Australia's maternal mortality is low but varies: Aboriginal and Torres Strait Islander mothers experience rates three times higher than the general population, with cardiovascular disease being the leading cause of maternal death