Self-Assessed Health Status and Life Expectancy (VCE SSCE Health and Human Development): Revision Notes
Self-Assessed Health Status and Life Expectancy
Introduction to measuring health status
When studying health and wellbeing, we explore the five dimensions: physical, social, mental, emotional and spiritual health. However, to understand the health of entire populations, we need measurable indicators that allow us to compare health status between different groups and countries.
Health status refers to an individual's or population's overall health, taking into account various aspects such as life expectancy, amount of disability and levels of disease risk factors.
For individuals, health status is typically measured through clinical tests like blood tests, blood pressure checks and heart rate monitoring. For populations, health status is measured using health indicators - standardised statistics that allow us to measure and compare health status across different groups.
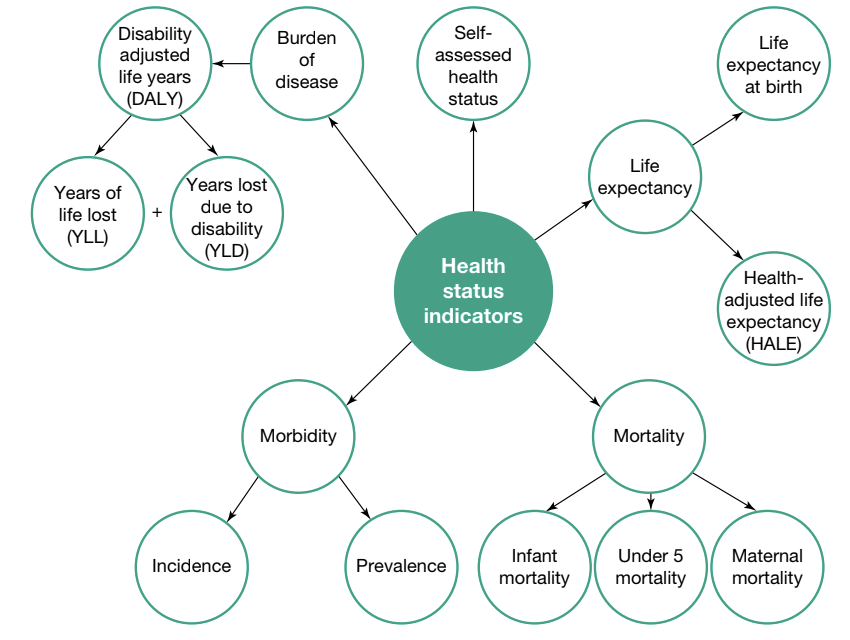
The diagram above shows the main health status indicators used to measure population health. These indicators work together to provide a comprehensive picture of health status. Examining multiple health indicators helps governments and organisations identify trends and target areas for improvement.
Key distinction: When discussing health and wellbeing, focus on the five dimensions. When discussing health status, focus on health indicators like life expectancy, mortality and morbidity rates.
It's important to note that health statistics are based on large population groups and represent averages. They don't necessarily reflect the health status of specific individuals or smaller population groups, such as Aboriginal and Torres Strait Islander peoples, whose health status may differ from national averages.
Self-assessed health status
What is self-assessed health status?
Self-assessed health status is an individual's own opinion about how they feel about their health, their state of mind and their life in general. This information is typically collected through population surveys and provides insight into people's perceptions of their overall physical, social, emotional, mental and spiritual health and wellbeing.
Survey participants classify their health status using five categories:
- Excellent
- Very good
- Good
- Fair
- Poor
Current data for Australia
In 2017-18, over half of Australians aged 15 years and over (56.4%) considered their health to be excellent or very good. Only 14.7% rated their health as fair or poor. This suggests that most Australians have a positive perception of their health and wellbeing.
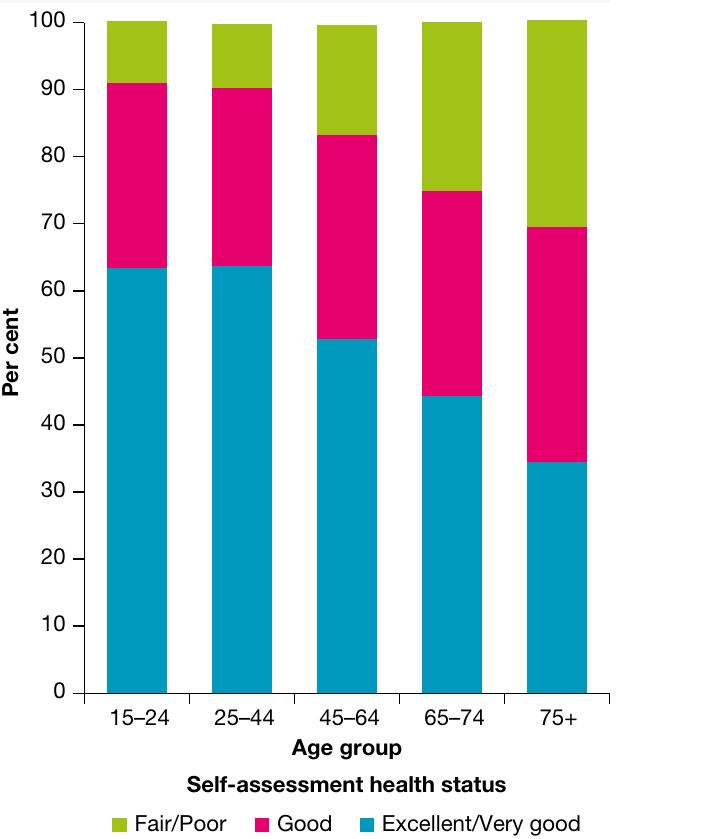
The graph above reveals an important trend: self-assessed health status declines with age. Young people aged 15-24 have the highest proportion reporting excellent or very good health (approximately 63%), while this decreases to about 34% for those aged 75 and over. Conversely, the proportion rating their health as fair or poor increases substantially with age.
Factors influencing self-assessment
Many factors affect how people assess their own health status, including:
- Presence or absence of disease, disability or illness
- Energy levels and physical functioning
- Access to healthcare services
- Quality of social connections and relationships
- Mental state and thought patterns
- Sense of belonging within the community
- Emotional health and wellbeing, including resilience levels
Limitations of self-assessed health status
While self-assessed health status provides a useful broad picture of population health and wellbeing, it has important limitations:
Subjectivity: This measure is entirely subjective. One person's "excellent" health might be another person's "very good" health. People's expectations and comparisons differ based on their life experiences, age and health history.
Snapshot only: It provides a snapshot of perceived health at a single point in time and may not reflect longer-term health patterns.
Limited detail: It doesn't identify specific health conditions or provide information about particular health issues affecting the population.
Despite these limitations, self-assessed health status remains valuable because it captures people's holistic perception of their health across all dimensions of wellbeing.
Life expectancy
Understanding life expectancy
Life expectancy is the number of years of life, on average, remaining to an individual at a particular age if death rates do not change. The most commonly used measure is life expectancy at birth, which indicates how long a baby born today can expect to live on average.
However, life expectancy can be calculated for people at any age. For example, we can calculate the remaining life expectancy for someone aged 60 or 75.
Current Australian data
Australia performs well internationally in terms of life expectancy:
| Sex | Life expectancy at birth (2019) |
|---|---|
| Males | 80.9 years |
| Females | 85.0 years |
| Global average | 72.5 years |
Australian life expectancy significantly exceeds the global average of 72.5 years for babies born in 2019. Australian females can expect to live approximately 4 years longer than males.
Life expectancy increases with age
An important concept to understand is that life expectancy increases as a person gets older. This seems counterintuitive at first, but makes sense when you consider that the figures are based on average age at death.
| Age | Males | Females |
|---|---|---|
| 0 (birth) | 80.9 | 85.0 |
| 15 | 81.3 | 85.4 |
| 30 | 81.8 | 85.6 |
| 45 | 82.5 | 86.1 |
| 60 | 84.1 | 87.1 |
| 75 | 87.4 | 89.4 |
| 90 | 94.4 | 95.1 |
Worked Example: Understanding Life Expectancy by Age
A male born in 2019 can expect to live to 80.9 years, but a 60-year-old male in 2019 can expect to live to 84.1 years.
Why the difference?
People who survive through infancy, childhood, youth and early adulthood have already passed through periods where some deaths occur. Those early deaths lower the average for babies at birth, but once someone reaches 60, they've already survived those risky periods, so their remaining life expectancy is higher.
Historical trends in life expectancy
Life expectancy in Australia has increased dramatically over the past century, rising by more than 30 years.
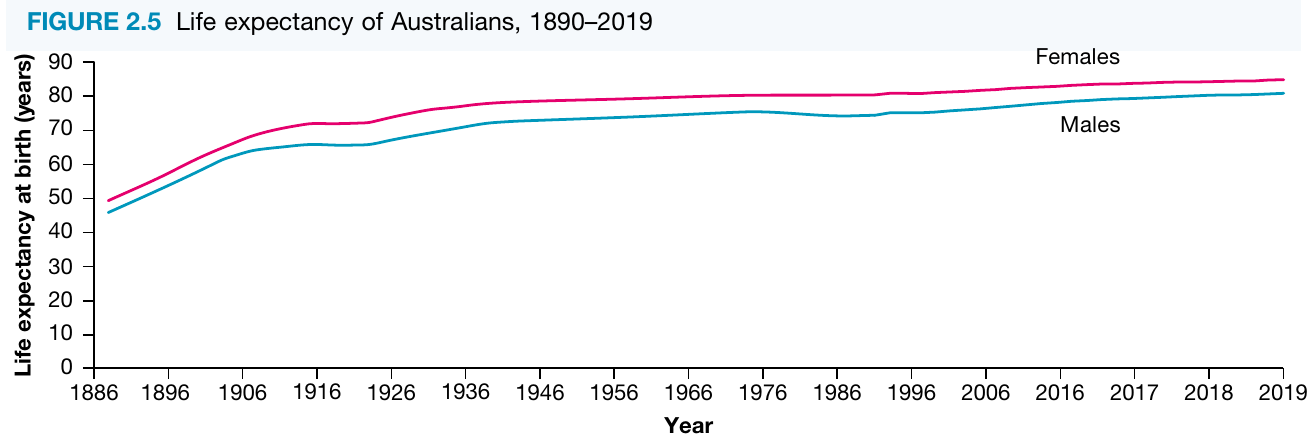
The graph shows that in 1890, life expectancy was approximately 47 years for males and 50 years for females. By 2019, these figures had increased to 80.9 years for males and 85.0 years for females.
Key observations from the historical data:
- The steepest increases occurred between 1890 and 1930
- Growth has been more gradual since the mid-20th century
- Females have consistently had higher life expectancy than males throughout the entire period
- The gap between male and female life expectancy has remained relatively stable
Life expectancy continues to increase, although some experts question whether these improvements can continue indefinitely, particularly given trends such as increasing obesity rates.
Uses and limitations of life expectancy
Uses:
- Comparing health status between different countries and population groups
- Identifying areas where improvements are needed
- Tracking changes in health status over time
- Setting public health goals and priorities
Limitations of life expectancy as a health indicator:
- Provides no information about the quality of life being experienced
- Doesn't indicate specific health issues or diseases affecting the population
- Doesn't reveal leading causes of death
- Based purely on quantity (length) of life, not quality
Health-adjusted life expectancy (HALE)
What is HALE?
To address the limitation that life expectancy only measures quantity of life, health experts developed health-adjusted life expectancy (HALE) - the average length of time an individual at a specific age can expect to live in full health. This means time lived without the health consequences of disease or injury.
HALE represents the number of years a person can expect to live without reduced functioning due to ill health. Reduced functioning includes decreased mobility and decline in the functioning of body systems. Therefore, HALE is an indicator of both the quantity and quality of life.
Understanding the difference between life expectancy and HALE
Life expectancy tells us how long people live on average. HALE tells us how many of those years are lived in good health, free from disability and illness.
Worked Example: Life Expectancy vs HALE
If someone lives to 85 years but spends the last 15 years with significant health problems and disability:
- Their life expectancy is 85 years
- Their HALE is 70 years
- Years lived in ill health: 15 years
This shows that while they lived to 85, only 70 of those years were lived in full health.
Current Australian HALE data
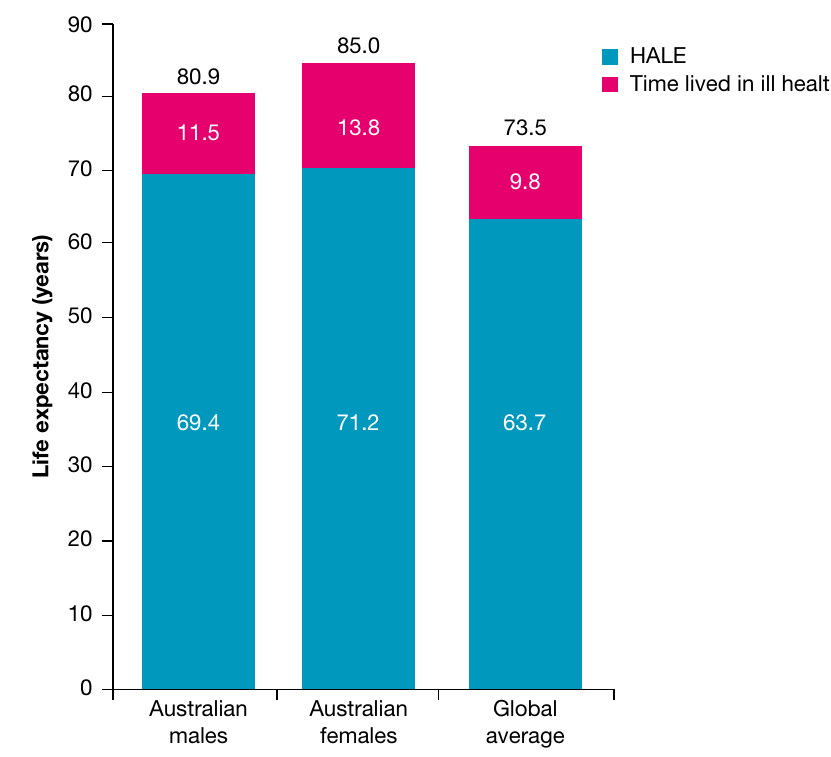
The data shows:
Australian males (born 2019):
- Total life expectancy: 80.9 years
- HALE (healthy years): 69.4 years
- Years lived in ill health: 11.5 years
Australian females (born 2019):
- Total life expectancy: 85.0 years
- HALE (healthy years): 71.2 years
- Years lived in ill health: 13.8 years
Global average (born 2019):
- Total life expectancy: 73.5 years
- HALE (healthy years): 63.7 years
- Years lived in ill health: 9.8 years
Key observations from HALE data
Gender differences: Although females live longer than males on average, they also spend more years living with ill health (13.8 years compared to 11.5 years for males).
Australian advantage: Both Australian males and females have higher HALE than the global average, indicating better quality of life in Australia.
Significant time with ill health: Even in Australia, people spend a considerable portion of their lives with ill health - over a decade on average.
Important note: While years with ill health are more likely to occur as people age, illness and disability can happen at any stage of life. HALE accounts for the average time spent with ill health throughout a person's entire lifespan.
Why HALE matters
HALE provides a more complete picture of population health than life expectancy alone. It helps:
- Identify whether increases in life expectancy are accompanied by good health
- Guide health promotion and disease prevention efforts
- Assess the effectiveness of healthcare systems
- Compare quality of life between populations and countries
- Set goals not just for living longer, but for living healthier
Key Points to Remember:
-
Health status is measured using health indicators for populations, while individual health status uses clinical tests.
-
Self-assessed health status is subjective and reflects people's own perceptions of their health across all dimensions of wellbeing. It declines with age but doesn't provide specific information about health conditions.
-
Life expectancy measures the average length of life and increases as people get older. Australian life expectancy (80.9 years for males, 85.0 years for females) exceeds the global average and has increased by over 30 years in the past century.
-
HALE (health-adjusted life expectancy) measures both the quantity and quality of life by indicating how many years are lived in full health. Australians can expect to live approximately 11-14 years with ill health.
-
Females live longer than males but also spend more years with ill health. Both Australian males and females have better life expectancy and HALE than global averages.