Differences Between High and Low Socioeconomic Status Population Groups (VCE SSCE Health and Human Development): Revision Notes
Differences Between High and Low Socioeconomic Status Population Groups
Understanding the social gradient
Socioeconomic status has a significant impact on health outcomes across Australian populations. The relationship between SES and health follows what is known as the social gradient - health status improves progressively with each step up the socioeconomic ladder. This means that individuals in high SES groups generally experience better health outcomes than those in low SES groups, with gradual improvements observed at each level in between.
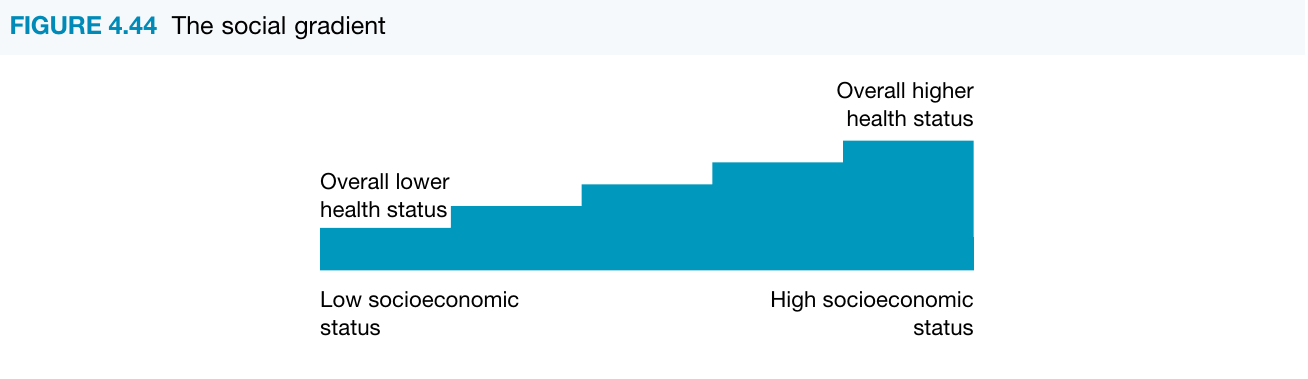
The social gradient is not simply a divide between rich and poor. It represents a continuous progression where each step up the socioeconomic ladder is associated with better health outcomes. This means even middle-income groups experience better health than those just below them, but worse health than those just above.
People in higher socioeconomic groups typically have greater access to resources, more choices, and better opportunities that support good health. In contrast, those in lower socioeconomic groups face numerous disadvantages that contribute to poorer health status. Understanding these differences is essential for addressing health inequalities in Australia.
Key differences in health status
Australians living in lower socioeconomic groups experience significantly worse health outcomes across multiple indicators when compared to those in higher socioeconomic groups.
Mortality and life expectancy
Life expectancy is approximately three years lower for the most disadvantaged groups compared to the most advantaged. This substantial gap reflects the cumulative impact of various health risks and limited access to health-promoting resources throughout life.
Mortality rates among low SES groups are 1.5 times higher than those experienced by high SES groups. This means that for every 100 deaths in high SES groups, there are approximately 150 deaths in low SES groups - a difference that represents thousands of preventable deaths across Australia.
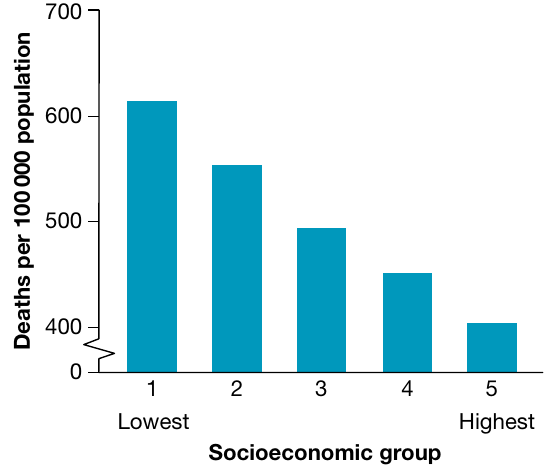
The graph above clearly demonstrates how mortality rates decrease progressively from the lowest to the highest socioeconomic groups, with the lowest SES group experiencing approximately 615 deaths per 100,000 population compared to about 405 deaths per 100,000 in the highest SES group.
Burden of disease
Low socioeconomic groups experience a greater burden of disease for both fatal and non-fatal outcomes. The data below shows how disease burden (measured in DALYs) is distributed across socioeconomic quintiles.
Understanding Quintiles
Quintiles are used when the population has been divided into fifths, with each quintile representing 20% of the population. Quintile 1 refers to the most disadvantaged fifth of the population in terms of socioeconomic position, while Quintile 5 represents the most advantaged.
| Socioeconomic group | Total burden DALY ('000) | Total burden age-standardised rate (per 1000 people) | Total burden rate ratio |
|---|---|---|---|
| Quintile 1 (lowest) | 1129 | 219.7 | 1.5 |
| Quintile 2 | 1068 | 201.9 | 1.4 |
| Quintile 3 | 960 | 185.3 | 1.3 |
| Quintile 4 | 827 | 165.1 | 1.1 |
| Quintile 5 (highest) | 732 | 144.7 | 1.0 |
The rate ratio indicates how many DALYs were contributed in each group for every 1 DALY contributed by those in the highest socioeconomic group. For example, the rate ratio of 1.5 for Quintile 1 shows that for every 1 DALY contributed by the highest SES group, there were 1.5 DALYs contributed by the lowest SES group.
Infant and child mortality
Infant mortality rates are significantly higher among low SES groups. Babies born into low socioeconomic families were 35% more likely to have low birth weight compared to those from high SES families (8% compared with 5.6%). This contributes to higher rates of under-five mortality, infections, and disabilities.
Specific health conditions and morbidity
Lower socioeconomic groups experience substantially higher rates of morbidity across numerous chronic conditions:
| Condition | Lowest SES group (%) | Highest SES group (%) | Rate ratio |
|---|---|---|---|
| Arthritis | 19.0 | 11.4 | 1.7 |
| Asthma | 13.3 | 10.0 | 1.3 |
| Back problems | 18.7 | 13.6 | 1.4 |
| Chronic kidney disease | 1.3 | 0.9 | 1.4 |
| Cardiovascular disease | 6.0 | 3.9 | 1.5 |
| Diabetes | 7.4 | 3.4 | 2.2 |
| Lung cancer incidence | 54 per 100,000 | 31 per 100,000 | 1.7 |
| Mental and behavioural problems | 24.3 | 16.0 | 1.5 |
Type 2 diabetes shows the largest disparity, with low SES groups experiencing more than double the rate (2.2 times) of high SES groups. Mental and behavioural problems are also 1.5 times more prevalent in low SES populations, highlighting the interconnection between socioeconomic disadvantage and both physical and mental health.
Potentially avoidable deaths
Low socioeconomic groups experience higher rates of potentially avoidable deaths - deaths that could have been prevented through either prevention strategies or treatment within the current health system. Examples include deaths from road traffic accidents, lung cancer, diabetes, and skin cancer. These deaths highlight how socioeconomic disadvantage limits access to prevention programs and timely, effective healthcare.
Biological factors contributing to health variations
Several biological factors contribute to the poorer health status observed in low socioeconomic groups. These factors are interconnected and often result from the social and environmental conditions experienced by these populations.
The "BBGB" Biological Factors
Remember the four key biological factors that disproportionately affect low SES groups:
- Body weight (obesity and overweight)
- Blood pressure (hypertension)
- Glucose regulation (impaired glucose regulation and diabetes)
- Birth weight (low birth weight babies)
Body weight
Rates of overweight and obesity are significantly higher among low SES groups. The data shows a clear gradient, with obesity rates decreasing as socioeconomic status increases.
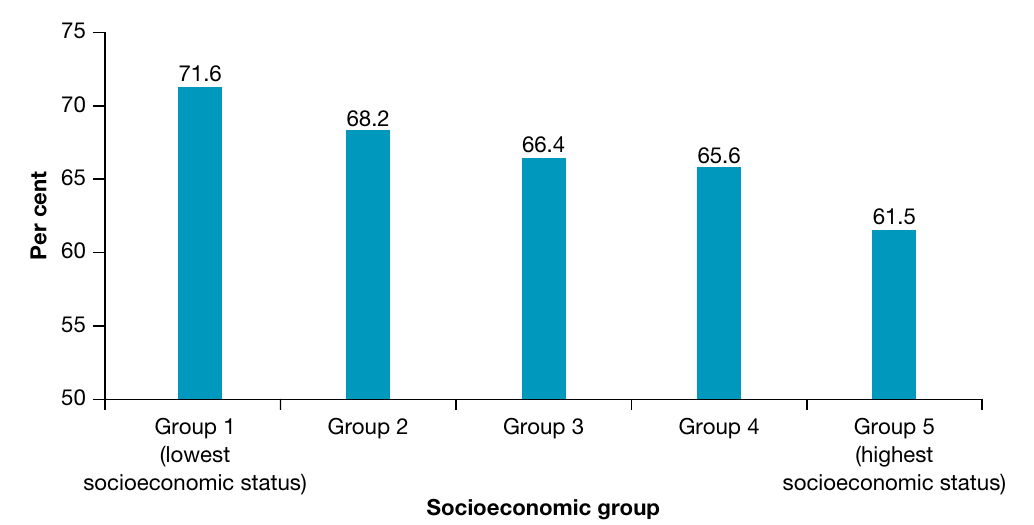
The lowest socioeconomic group shows an overweight/obesity rate of 71.6%, which progressively decreases through the middle groups (68.2%, 66.4%, 65.6%) to 61.5% in the highest socioeconomic group. This difference of approximately 10 percentage points between the lowest and highest groups is substantial.
Higher body mass contributes to reduced life expectancy, primarily due to increased rates of death from conditions such as cardiovascular disease and type 2 diabetes. The higher obesity rates in low SES groups help explain the elevated burden of these chronic diseases.
Blood pressure
Hypertension (high blood pressure) is more prevalent in low socioeconomic groups, affecting approximately 25% of this population compared to 20% in the highest socioeconomic group. This 5 percentage point difference may seem small, but it translates to thousands of additional people at risk.
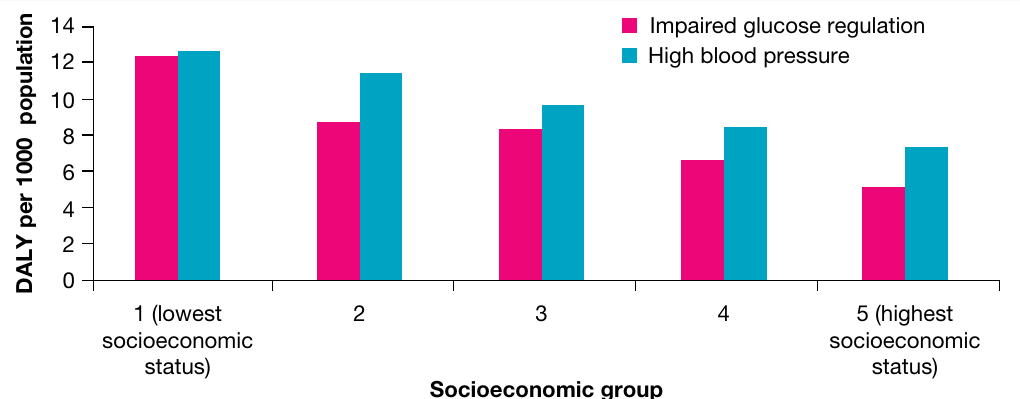
High blood pressure contributes significantly to the disease burden experienced by low SES groups. The graph shows that the lowest socioeconomic group experiences approximately 12-13 DALYs per 1000 people from high blood pressure, compared to about 7 DALYs per 1000 in the highest group - nearly double the burden.
This elevated blood pressure leads to higher rates of cardiovascular disease and contributes to premature death.
Glucose regulation
Impaired glucose regulation is another biological risk factor that disproportionately affects low socioeconomic groups. This condition, which can lead to type 2 diabetes, follows the same gradient pattern as other biological factors.
As shown in the graph above, impaired glucose regulation contributes approximately 12 DALYs per 1000 people in the lowest socioeconomic group, compared to about 5 DALYs per 1000 in the highest group. This significant difference helps explain the 2.2 times higher rate of diabetes in low SES populations and contributes to higher rates of kidney disease and other complications.
Birth weight
Women experiencing socioeconomic disadvantage are more likely to give birth to babies with low birth weight. As noted earlier, babies born into low SES families were 35% more likely to have low birth weight (8% of births compared to 5.6% in high SES families).
Low birth weight has serious implications for child health and development. It contributes to:
- Higher rates of under-five mortality
- Increased susceptibility to infections
- Greater likelihood of disability
- Potential long-term health consequences into adulthood
This demonstrates how socioeconomic disadvantage can affect health outcomes from the very beginning of life, potentially setting a trajectory for ongoing health challenges. The intergenerational nature of health disadvantage means children born into low SES families start life with immediate health risks.
Sociocultural factors contributing to health variations
A complex web of sociocultural factors helps explain why low socioeconomic groups experience poorer health outcomes. These factors are often interconnected and reinforce each other, creating a cycle of disadvantage.
Education and income
People in low SES groups typically have lower educational attainment, lower incomes, and jobs with lower social status. These three factors are closely interrelated and form the foundation of socioeconomic disadvantage.

Education plays a crucial role in health outcomes. According to AIHW data, individuals with lower average incomes experience lower levels of health literacy compared to those with higher incomes.
Understanding Health Literacy
Health literacy refers to the ability to access, understand, and use health information to make informed decisions about health. It's not just about reading ability - it encompasses understanding medical advice, navigating the healthcare system, and making informed choices about health behaviors.
Lower health literacy contributes to several health-related challenges:
- Reduced likelihood of accessing healthcare services, including during pregnancy
- More health conditions going undiagnosed and untreated
- Difficulty understanding health information and following medical advice
- Higher rates of preventable morbidity and mortality, including among pregnant women and children
The relationship between education, income, and health behaviors is clearly demonstrated by the data on risk factors:
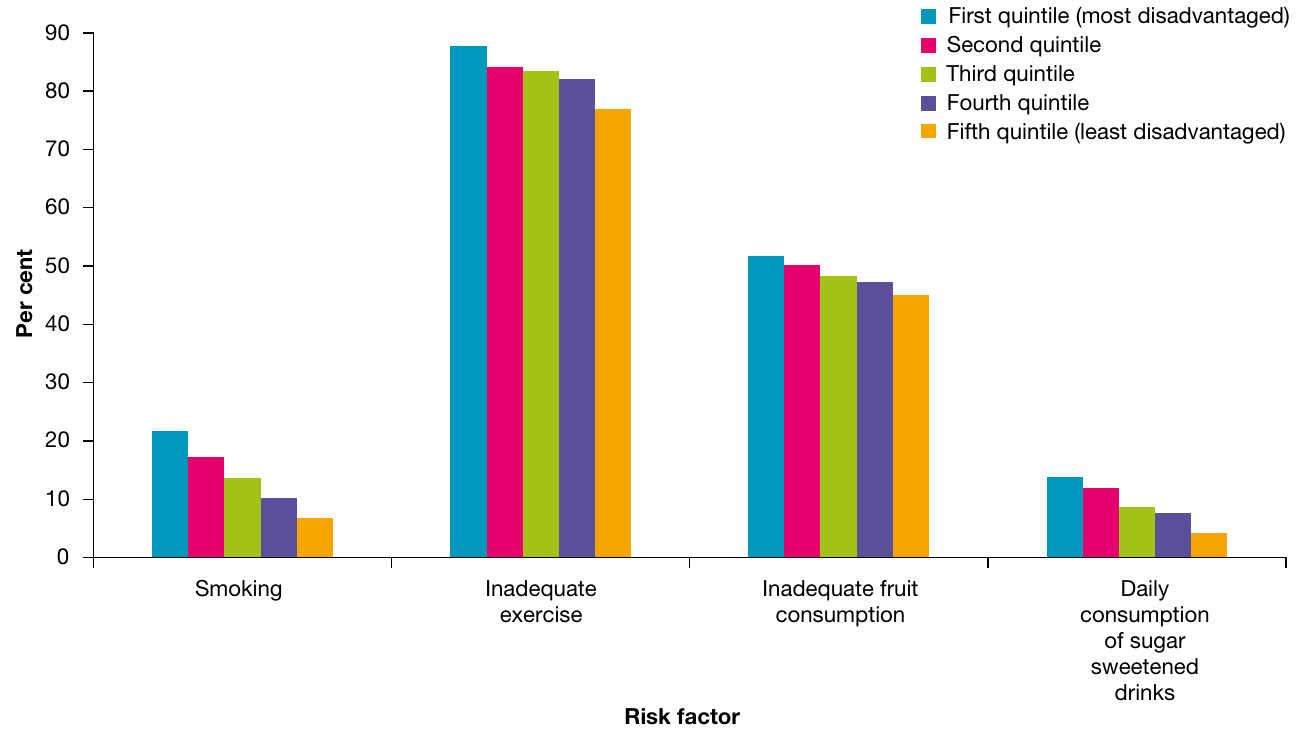
This graph shows the prevalence of four key risk factors across socioeconomic quintiles:
- Smoking: The most disadvantaged group shows rates around 21%, declining to about 7% in the least disadvantaged
- Inadequate exercise: Affects 80-88% across all groups, but is consistently highest in the most disadvantaged
- Inadequate fruit consumption: Shows a gradient from about 52% in the most disadvantaged to 43% in the least disadvantaged
- Daily sugar-sweetened drink consumption: Approximately 14% in the most disadvantaged, dropping to about 5% in the least disadvantaged
These behavioral differences directly contribute to the variations in health status, including lower life expectancy and higher rates of chronic disease. The gradient pattern across all four risk factors demonstrates how socioeconomic disadvantage affects multiple aspects of health behavior simultaneously.
Those in lower socioeconomic groups may also feel they have less control over their lives (including finances, work, and health status). This sense of helplessness can lead to a reluctance to modify risk factors such as smoking, contributing to higher rates of premature mortality and lower life expectancy.
Unemployment
Unemployment is both a cause and consequence of poor health, creating a cyclical relationship. People experiencing socioeconomic disadvantage are more likely to be unemployed, and unemployment itself contributes to poorer health outcomes.
The comparison between unemployed and employed individuals reveals stark differences:
- Mental/behavioural problems: Significantly higher among unemployed individuals (approximately 30% vs 16%)
- Inadequate fruit consumption: Higher among unemployed (about 60% vs 50%)
- Low/no exercise: Extremely high in both groups but slightly higher among unemployed (approximately 86% vs 80%)
- Current daily smoker: Much higher among unemployed (approximately 28% vs 13%)
- Daily sugar-sweetened drinks: Higher among unemployed (approximately 18% vs 8%)
These differences illustrate how unemployment contributes to increased risk-taking behaviors and poorer health outcomes, which in turn can make it harder to gain employment - thus perpetuating the cycle of disadvantage. Breaking this cycle requires addressing both employment opportunities and health support simultaneously.
Social exclusion
Socioeconomic disadvantage often leads to social exclusion, where individuals are less likely to:
- Gain quality education
- Find meaningful employment
- Access community resources such as healthcare and social security
- Participate fully in society
Social exclusion creates a cycle of disadvantage that can be difficult to break. Those who are socially excluded experience poorer physical and mental health and wellbeing compared to those who are socially connected. The lack of social connections and community engagement can increase stress, reduce access to support networks, and limit opportunities for health-promoting activities.
Food security
Definition: Food Security
Food security is defined as "the state in which all persons obtain nutritionally adequate, culturally appropriate, safe food regularly through local non-emergency sources."
Unfortunately, people living with socioeconomic disadvantage are more likely to experience food insecurity. Several factors contribute to food insecurity in low SES groups:
- Financial constraints: Lack of income makes it difficult to afford nutritious foods
- Limited access: Research shows that healthy food options are often more expensive and harder to access in areas of socioeconomic disadvantage
- Knowledge gaps: Those with low SES may lack sufficient knowledge about what constitutes healthy eating
- Economic food choices: People on low incomes tend to maximize energy availability per dollar, buying foods that provide the most energy (kilojoules) for the least cost, even if these foods have few other nutrients
The consequences of food insecurity include:
- Higher rates of obesity (as energy-dense, nutrient-poor foods are often cheaper)
- Lower rates of fruit and vegetable consumption
- Increased risk of cardiovascular disease
- Higher rates of type 2 diabetes
- Elevated risk of some types of cancer
Early life experiences
Early life experiences have profound and lasting impacts on health outcomes, and these experiences differ significantly between socioeconomic groups.
Critical Early Life Disparity
Mothers in the lowest socioeconomic groups were more than six times as likely to smoke during pregnancy compared to those in the highest socioeconomic groups (17.2% versus 2.7%). This dramatic difference represents one of the most significant early life risk factors affecting infant and child health.
Maternal smoking during pregnancy contributes to:
- Higher rates of respiratory conditions such as asthma in children
- Increased incidence of low birth weight babies
- Higher infant and under-five mortality rates
Women from the lowest socioeconomic areas also experience other pregnancy-related disadvantages:
- More likely to begin antenatal care later in pregnancy
- Higher body mass index during pregnancy
- Greater likelihood of giving birth prematurely (pre-term)
- Higher rates of babies born with low birth weight
These early life disadvantages set the stage for ongoing health challenges throughout childhood and potentially into adulthood, perpetuating health inequalities across generations.
Access to healthcare
Healthcare access is significantly limited for low socioeconomic groups, contributing to worse health outcomes through several mechanisms.
Preventative and early detection services are underutilized by low SES populations. For example, people from low SES groups are less likely to access:
- BreastScreen services
- Cervical cancer screening
- Regular health check-ups
- Dental care
This reduced access means health conditions often go undiagnosed until they reach advanced stages. Once a diagnosis is finally made, fewer treatment options may be available, contributing to higher rates of mortality from conditions such as breast and cervical cancer.
Private health insurance rates differ dramatically between socioeconomic groups. Approximately 66.8% of the most disadvantaged do not have private health insurance, compared with only 23.5% of the most advantaged. This gap in insurance coverage can lead to:
- Psychological distress related to health concerns
- Extended waiting times for surgery and specialist appointments
- Delayed treatment that increases morbidity and mortality
- Limited choice of healthcare providers and treatments
Neighbourhood safety
Feelings of safety in one's home and neighborhood differ substantially across socioeconomic groups and have important implications for mental health and wellbeing.
According to ABS data:
- People in highest SES areas: 94.4% feel safe or very safe at home alone at night
- People in lowest SES areas: 80.7% feel safe or very safe at home alone at night
When considering feeling safe walking in the local area at night:
- Highest SES areas: 68.7% feel safe or very safe
- Lowest SES areas: 49.1% feel safe or very safe
This nearly 20 percentage point difference in perceived safety while walking in the neighbourhood is substantial. Less than half of people in low SES areas feel safe walking in their neighborhood at night, compared to more than two-thirds in high SES areas.
Lower feelings of safety can:
- Increase anxiety and chronic stress
- Contribute to higher rates of mental health issues
- Limit physical activity (people may avoid walking or exercising outdoors)
- Reduce social connection and community engagement
- Impact overall quality of life and wellbeing
Environmental factors contributing to health variations
The physical environment in which people live, work, and spend their time plays a crucial role in shaping health outcomes. Environmental factors create important differences in health status between high and low socioeconomic groups.
Geographic location
The geographic distribution of health-related resources and hazards is not equal across different socioeconomic areas, creating an uneven landscape of health opportunities and risks.
Fast food outlets: Areas with greater socioeconomic disadvantage often have the highest concentration of fast food outlets. Fast food is typically higher in fat, salt, and sugar than other food options. Living in close proximity to numerous fast food outlets may increase consumption of these foods, particularly among people who:
- Have limited knowledge about healthy eating
- Are more susceptible to marketing influences
- Face time and budget constraints that make fast food seem convenient
This concentration of fast food outlets contributes to higher rates of obesity and associated conditions such as cardiovascular disease and type 2 diabetes.
Recreational facilities and public open spaces: According to VicHealth research, significant disparities exist in the quality of sports and recreational facilities based on neighborhood socioeconomic status. While the number of playgrounds or leisure facilities may be similar across areas, important differences emerge in quality:
Quality Differences in Public Spaces
High SES neighbourhoods have public open spaces with:
- Better amenities (picnic areas, seating, facilities)
- Superior aesthetics (well-maintained landscaping, water features)
- Better shade provision through trees and foliage
- More extensive walking and cycling paths
- Overall higher quality maintenance
Low SES neighbourhoods typically have:
- Similar numbers of facilities but lower quality
- Fewer amenities and less aesthetic appeal
- Less adequate shade and landscaping
- Limited or poorly maintained paths
These quality differences contribute to lower rates of physical activity in lower socioeconomic groups. When recreational spaces are less appealing, poorly maintained, or lack basic amenities, people are less motivated to use them for exercise and recreation. This contributes to many of the health status variations observed between socioeconomic groups.
Housing
Housing quality varies significantly by socioeconomic status, with those in lower SES groups more likely to live in substandard housing conditions that directly impact health.
Overcrowding: Low SES households are more likely to experience overcrowding, which creates multiple health risks:
- Strain on sanitation facilities, resulting in increased rates of infectious diseases
- Increased transmission of respiratory infections and other communicable diseases
- Elevated rates of psychological distress and mental health disorders due to lack of privacy and personal space
- Increased family tension and stress
Inadequate cooking facilities: Many low SES households lack proper cooking facilities, leading to:
- Greater reliance on processed and pre-prepared foods
- Higher consumption of energy-dense, nutrient-poor foods
- Increased rates of obesity and associated conditions such as cardiovascular disease and type 2 diabetes
- Limited ability to prepare fresh, healthy meals
Housing Hazards in Low SES Areas
Lower quality housing often includes various safety hazards that directly impact health:
- Inadequate ventilation, which can worsen respiratory conditions
- Fire hazards such as unserviced heating appliances and lack of smoke detectors
- Structural issues and poor maintenance
- Exposure to damp and mould
These hazards increase the risk of injuries, respiratory conditions such as asthma, and other health problems.
Proximity to industrial sites: Low SES housing is more frequently located near industrial areas, resulting in:
- Higher levels of air pollution from factories and industrial processes
- Increased noise pollution
- Greater exposure to potential toxic substances
- Elevated rates of respiratory diseases, cardiovascular problems, anxiety, and stress
Environmental tobacco smoke exposure: Since smoking rates are higher among low SES groups, children and non-smoking adults in these households face increased exposure to environmental tobacco smoke. According to AIHW data, children living in households in the lowest SES areas were nearly four times as likely as those in the highest SES areas to be exposed to tobacco smoke in the home (7.2% compared with 2%).
This exposure increases the risk of:
- Sudden infant death syndrome (SIDS)
- Respiratory diseases such as asthma and bronchitis
- Ear infections in children
- Cardiovascular disease
- Various types of cancer
Work environment
Employment conditions and workplace environments differ significantly across socioeconomic groups, with important health implications.
People experiencing socioeconomic disadvantage are more likely to work in occupations that involve:
- Dangerous working environments (factories, manufacturing plants, construction sites)
- Exposure to toxic substances and chemicals
- Operation of or proximity to heavy machinery
- Physically demanding labor
- Shift work and irregular hours
- Limited workplace safety protections
These occupational hazards contribute to:
- Higher rates of workplace injuries
- Increased incidence of respiratory conditions from dust, fumes, or chemical exposure
- Elevated risk of some cancers due to occupational exposures
- Greater rates of musculoskeletal disorders
- Higher levels of work-related stress and fatigue
The cumulative impact of dangerous work environments adds to the overall burden of disease experienced by low socioeconomic groups and contributes to their higher rates of illness, injury, and premature death.

Case study: Obesogenic environments and socioeconomic disadvantage
Research from the University of Wollongong has examined the relationship between socioeconomic disadvantage and obesity in Australia. Over the past two decades, obesity prevalence rose from 19% to 28% in Australian adults, with the proportion who are overweight remaining at around 38%. This means two-thirds of Australian adults are now either overweight or obese.
Research Finding: Obesity Risk in Disadvantaged Areas
Analysis of data from almost 37,000 patients showed that both men and women living in areas of highest socioeconomic disadvantage had a 29% higher risk of being obese compared to those in less disadvantaged areas.
This finding demonstrates a clear link between neighborhood disadvantage and individual health outcomes.
The term obesogenic refers to the sum of influences that physical surroundings have on promoting excessive weight gain. Obesogenicity of neighborhoods may relate to:
- The food environment (access to healthy versus unhealthy food sources)
- The physical activity environment (availability and quality of green space, safe neighborhoods)
However, the relationship between neighborhood obesogenicity and individual body weight is complex. Australian research has found some surprising patterns:
Supermarket access: While proximity to supermarkets might seem beneficial, approximately 30% of supermarket shelf space is dedicated to non-core (junk) foods, regardless of the supermarket's location. However, low-SES shoppers buy significantly more non-core foods than high-SES shoppers, particularly chips, sugar-sweetened carbonated beverages, and cordials.
This purchasing pattern is likely driven by economic factors. People on low incomes tend to maximize energy availability per dollar, buying foods that provide the most kilojoules for the least cost, even if these foods have minimal nutritional value beyond energy.
Green space effects: Research in NSW found that proximity to green space was associated with more moderate-to-vigorous physical activity and less sitting time in both men and women. However, this activity translated into lower body weight only in women. Women living close to green space had a 10-20% lower risk of being overweight or obese compared to those living further away. The same relationship was not found in men, possibly because men may compensate for increased activity by eating more.
Public Health Implications
The research highlights the need for preventative health initiatives that are specific to both gender and the socioeconomic characteristics of the target population.
In areas of highest socioeconomic disadvantage, primary care providers could streamline approaches to direct obese patients to existing weight loss programs. In areas of lower disadvantage, efforts could focus on preventing weight gain in adults who are already in the overweight range.
Summary of factors contributing to health variations
Interconnected Factors Creating Health Disparities
The health disparities between high and low socioeconomic groups result from a complex interplay of biological, sociocultural, and environmental factors. These factors are interconnected and often reinforce each other, creating cumulative disadvantages for those in lower socioeconomic positions.
Biological factors that contribute to poorer health in low SES groups include:
- Higher rates of obesity (71.6% vs 61.5%)
- Higher rates of hypertension (25% vs 20%)
- Higher rates of impaired glucose regulation
- Higher rates of low birth weight babies (8% vs 5.6%)
Sociocultural factors create barriers to health and wellbeing:
- Lower incomes, education levels, and occupational status
- Reduced health literacy
- Higher unemployment rates
- Greater social exclusion
- More likely to experience food insecurity
- Disadvantaged early life experiences (17.2% vs 2.7% maternal smoking)
- Reduced access to healthcare (66.8% vs 23.5% without private insurance)
- Lower levels of neighborhood safety (49.1% vs 68.7% feel safe walking at night)
Environmental factors shape daily health opportunities and risks:
- Greater proximity to fast-food outlets
- Lower quality public open spaces and recreational facilities
- More dangerous work environments
- Poorer quality housing with more overcrowding
- Greater exposure to environmental tobacco smoke
- Higher levels of air and noise pollution
These factors combine to produce the significant health status differences observed between high and low socioeconomic groups, including a three-year gap in life expectancy, 1.5 times higher mortality rates, and substantially elevated rates of chronic diseases such as diabetes (2.2 times higher) and cardiovascular disease (1.5 times higher).
Remember!
- The social gradient means health improves at each step up the socioeconomic ladder - it's not just a gap between rich and poor, but a progressive improvement from lowest to highest SES.
- Low SES groups experience approximately 3 years lower life expectancy and 1.5 times higher mortality rates compared to high SES groups, with the disease burden rate ratio reaching 1.5 in the most disadvantaged quintile.
- Biological risk factors (obesity, hypertension, impaired glucose regulation, low birth weight) are all significantly higher in low SES groups and directly contribute to higher rates of chronic diseases like cardiovascular disease and type 2 diabetes.
- Sociocultural factors create interconnected disadvantages - lower education leads to lower income and reduced health literacy, which contributes to higher risk behaviors, less healthcare access, and ultimately poorer health outcomes.
- Environmental factors create "obesogenic" conditions in low SES areas through greater concentration of fast food outlets, lower quality recreational facilities, poorer housing conditions, and more dangerous work environments that all limit health opportunities.