Mean and Percentiles for a Continuous Random Variable (VCE SSCE Mathematical Methods): Revision Notes
Mean and Percentiles for a Continuous Random Variable
Introduction to measures of centre
When working with probability distributions, understanding the centre of the distribution is crucial. This tells us where the "middle" or "typical" values lie.
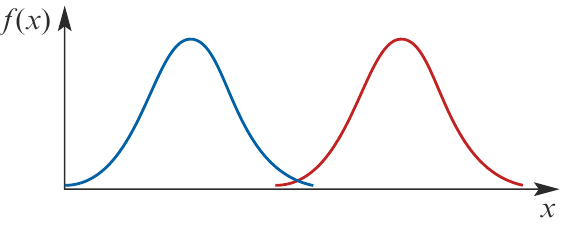
Two probability distributions can have identical shapes and spreads but be located at different positions on the number line. This difference in location is captured by measures of centre.
The most commonly used measure of centre for continuous random variables is the mean (also called the expected value). We'll also explore percentiles, which help us identify values that divide the distribution into specific proportions.
Mean (expected value)
What is the mean?
The mean of a continuous random variable represents the long-run average value we would expect to observe. Just as we can calculate a mean for discrete random variables, we can do the same for continuous random variables, but using integration instead of summation.
Definition
For a continuous random variable with probability density function , the mean or expected value of is:
provided the integral exists.
The mean is denoted by the Greek letter (mu).
If for all outside the interval , then we can simplify this to:
Interpretation
The expected value represents the average value of the random variable over a very long period of time. For instance, if we're measuring the daily demand for petrol at a service station, the mean tells us the average daily demand we'd observe over many years.
Worked Example: Finding the Expected Value
Find the expected value of the random variable which has probability density function:
Solution:
By definition:
since elsewhere.
Using technology
TI-Nspire:
- Access the piecewise function template using the template key
- Define the function with the appropriate pieces
- Leave the domain for the last function piece blank (it will autofill as 'Else')
- To get an exact answer, enter instead of
- Evaluate the definite integral
Casio ClassPad:
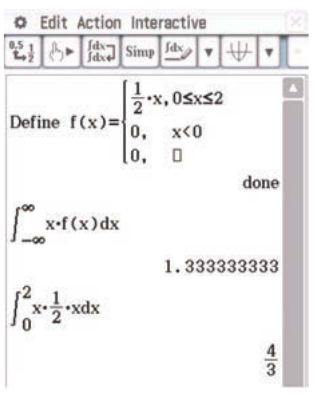
- Tap the piecewise template twice
- Define the function as shown in the diagram
- Find by evaluating the definite integral
- Note: Using the defined function gives the decimal answer only
Expected value of a function of X
Definition
Sometimes we need to find the expected value not of itself, but of some function applied to . If is a function and we want to find the expected value of , we use:
provided the integral exists.
Important property
Generally, the expected value of a function of is not equal to that function of the expected value of . That is:
However, there is one important exception: when is a linear function:
where and are constants.
Worked Example: Expected Value of Functions of X
Let be a random variable with probability density function given by:
Find: a) the expected value of and b) the expected value of .
Solution:
Part a:
Part b:
correct to three decimal places.
Percentiles
What are percentiles?
A percentile is a value that divides the distribution so that a specific percentage of values fall below it. For example, if you score at the 75th percentile on an exam, this means 75% of all students scored below you.
Definition
The value of which is the solution to the equation:
is called a percentile of the distribution.
For example:
- The 75th percentile is found by taking
- The 90th percentile is found by taking
- The 50th percentile is called the median
Worked Example: Finding the 90th Percentile
The duration of telephone calls to the order department of a large company is a random variable, minutes, with probability density function:
Find the value of such that 90% of phone calls last less than minutes.
Solution:
We need to find such that 90% of values are below it. This means solving:
Evaluating the integral:
correct to three decimal places.
Therefore, 90% of phone calls to this company last less than 6.908 minutes.
The median
What is the median?
The median is the 50th percentile - it's the middle value of the distribution. Half of all values fall below the median, and half fall above it.
While the median is a useful concept, it is not required by the VCE Mathematical Methods Study Design. However, understanding it can deepen your comprehension of probability distributions.
Definition
The median, , of a continuous random variable is the value such that:
This means:
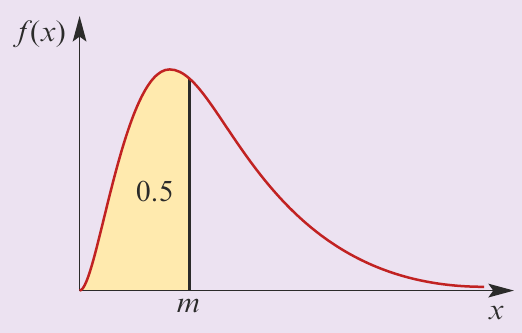
Graphically, the median divides the area under the probability density function exactly in half.
Worked Example: Finding the Median
Suppose the probability density function of weekly sales of topsoil, (in tonnes), is given by:
Find the value of such that , and interpret.
Solution:
We need to solve:
Evaluating the integral:
Using the quadratic formula:
Since , we must have tonnes.
Interpretation: In the long run, 50% of weekly sales will be less than 0.293 tonnes, and 50% will be more than 0.293 tonnes.
Using technology for median calculations
TI-Nspire:
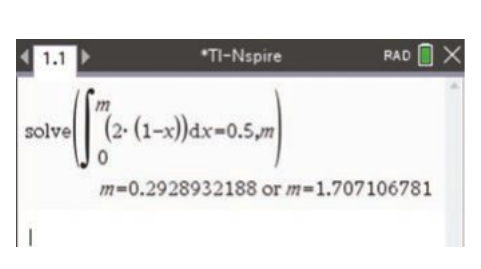
- Use the solve function with the definite integral equal to 0.5
- Since , you can add the domain constraint
Casio ClassPad:
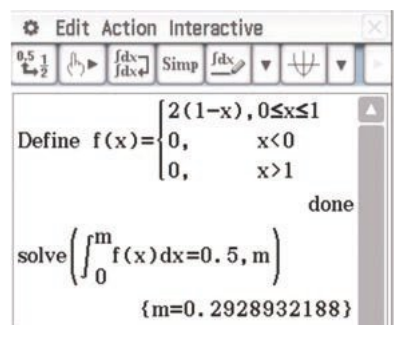
- Define the function first
- Use the solve function with the definite integral equal to 0.5 to find the median value
Remember!
Key Points to Remember:
-
Mean (Expected Value): For a continuous random variable with pdf , the mean is . It represents the long-run average value.
-
Expected Value of Functions: . Generally, , except for linear functions where .
-
Percentiles: The value where gives the th percentile. This tells you the value below which a certain percentage of the distribution falls.
-
Median: The 50th percentile, found by solving . It divides the distribution exactly in half (not required by the study design but useful for understanding distributions).
-
Calculator skills: You can use your CAS calculator to evaluate the integrals needed for finding means and percentiles. Remember to define piecewise functions correctly and use the solve function for finding percentile values.