The Normal Approximation to the Binomial Distribution (VCE SSCE Mathematical Methods): Revision Notes
The Normal Approximation to the Binomial Distribution
Introduction
When working with binomial distributions, you may notice something interesting happens as the sample size increases. The binomial distribution can start to look remarkably similar to a normal distribution. This observation allows us to use the normal distribution as an approximation to the binomial distribution under certain conditions, which simplifies many calculations.
The normal approximation is particularly valuable when dealing with large sample sizes, where calculating exact binomial probabilities becomes computationally intensive. This technique is widely used in statistical analysis and hypothesis testing.
How binomial distributions behave
The shape of a binomial distribution depends on two key parameters: the number of trials () and the probability of success (). Let's look at how these parameters affect the distribution's appearance.
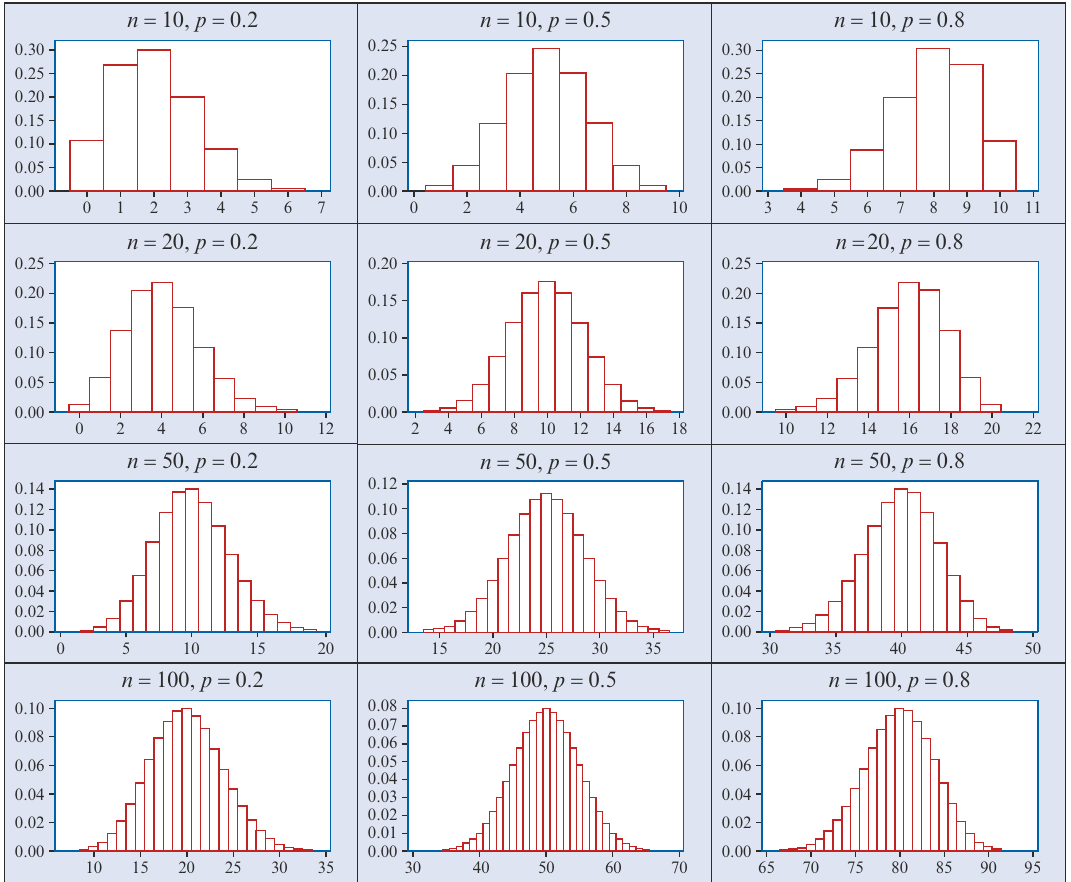
From these histograms, we can observe:
- When is small and is close to 0 or 1, the distributions are skewed (asymmetric)
- When is larger and is closer to 0.5, the distributions become more symmetric
- As increases, the distributions increasingly resemble a bell-shaped curve
Understanding Distribution Shape
The symmetry of the distribution is crucial for the normal approximation to work well. When distributions are highly skewed, the normal curve may not provide an accurate fit. This is why we need specific conditions before applying the approximation.
Visualising the approximation
Here's a concrete example showing how well the normal distribution can approximate a binomial distribution:
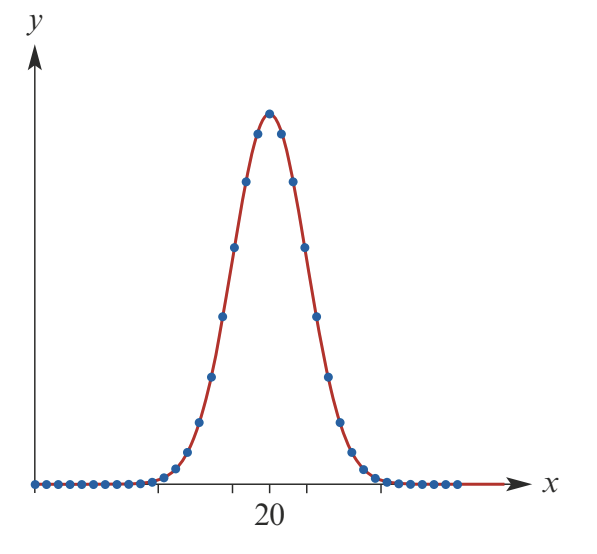
This diagram shows:
- Blue points: A binomial distribution with and
- Red curve: A normal distribution with the same mean and standard deviation
The two distributions align remarkably well! The binomial distribution has mean and standard deviation . The normal distribution drawn has exactly the same parameters.
When to use the normal approximation
The key principle
If the sample size is large enough, the skewness of the binomial distribution becomes negligible. In this case, we can use the normal distribution as a reasonable approximation. The approximation works best when:
- is large
- is not too close to 0 or 1
The approximating normal distribution
When we approximate a binomial random variable with a normal distribution, we use:
- Mean:
- Standard deviation:
These are exactly the same as the mean and standard deviation of the original binomial distribution.
Rule of thumb
To determine whether the normal approximation is appropriate, use this simple rule:
Normal Approximation Rule of Thumb
Both and must be greater than 5
This ensures the approximation will be satisfactory. When both values exceed 5, the binomial distribution is symmetric enough that the normal curve provides a good fit.
Worked example
Worked Example: Freeway Survey Problem
A sample of 1000 people from a city were asked whether they supported building a new freeway. We know that 30% of people in the city support the freeway. Find the approximate probability that between 270 and 330 people in the sample support it.
Solution
First, identify the situation as binomial and check whether we can use the normal approximation.
Let be the number of people in the sample who support the freeway. Then is a binomial random variable with and .
Calculate the mean and standard deviation:
So we have:
Check the rule of thumb:
- ✓
- ✓
Both conditions are satisfied, so we can use the normal approximation.
Now we need to find . Using the normal approximation with standardisation:
Therefore, the probability is approximately 0.9616 or 96.16%.
Note: If we calculate this probability using the exact binomial distribution instead, we get:
The normal approximation gives 0.9616, which is very close to the exact values. This demonstrates how effective the approximation can be!
Practice problems
Here are some situations where you can apply the normal approximation to the binomial distribution:
- Dice rolling: A die is rolled 100 times. What is the probability that more than 10 sixes will be observed?
- Election sampling: If 50% of voters favour candidate A, what is the probability that more than 156 in a sample of 300 will favour that candidate?
- Age demographics: A sample of 100 people is drawn from a city where 10% of the population is over 65. Find the probability that the sample contains:
- At least 15 people over 65
- No more than 8 people over 65
- Manufacturing defects: A process produces 40 defective items per 1000 on average. For a random sample of 400 items, find the probability of:
- At least 10 and no more than 20 defective items
- 25 or more defective items
- Sports participation: A survey found 40% of a city's population regularly participate in sport. What is the probability that fewer than 38% of a random sample of 200 people participate in sport?
- Multiple choice exam: An exam has 25 questions with four options each. A student needs at least 10 correct answers to pass. If they guess every answer:
- What is the probability they will pass?
- What is the probability they guess between 12 and 14 answers correctly?
Practice Tip
For each problem, remember to:
- Identify the binomial parameters and
- Check the rule of thumb before applying the approximation
- Calculate the mean and standard deviation
- Standardise and use normal distribution tables or technology
Summary
Key Points to Remember:
- The normal approximation to the binomial distribution works when is large and is not too close to 0 or 1
- Rule of thumb: Both and must be greater than 5 for a satisfactory approximation
- The approximating normal distribution has the same mean () and standard deviation () as the binomial distribution
- Always check the rule of thumb before using the approximation
- The approximation simplifies calculations significantly, especially for large values of where binomial calculations become impractical