The Normal Distribution (VCE SSCE Mathematical Methods): Revision Notes
The Normal Distribution
The standard normal distribution
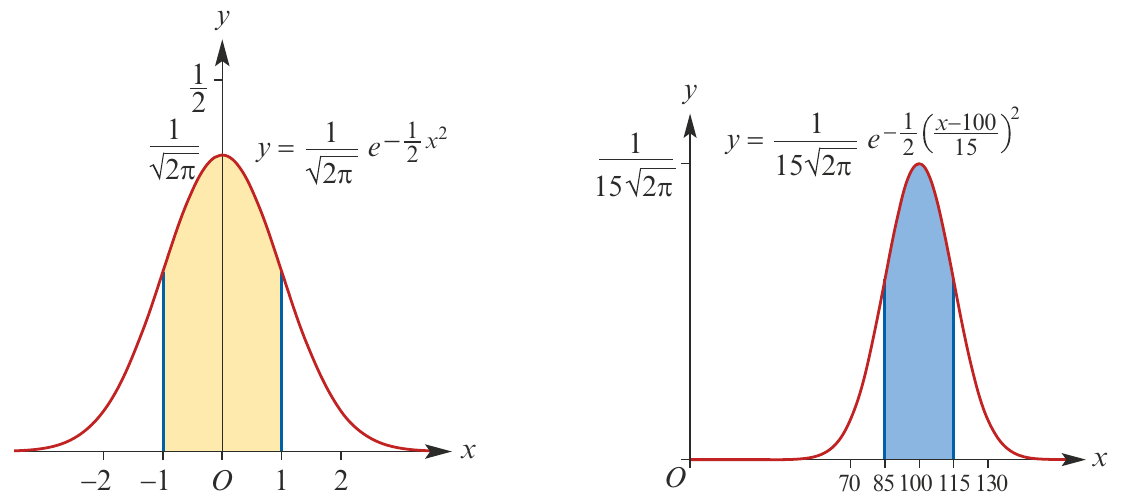
The most basic version of the normal distribution is called the standard normal distribution. This special distribution has a probability density function defined by:
where the domain is all real numbers ().
The graph of this function creates the familiar bell-shaped curve that is symmetric around the vertical line . This symmetry exists because , making it an even function.
The standard normal distribution serves as the foundation for all other normal distributions. Its simple form with mean 0 and standard deviation 1 makes it the reference point for probability calculations across all normal distributions.
Key features of the standard normal distribution curve:
- The line acts as a horizontal asymptote: as approaches , the curve approaches but never touches the -axis
- Almost all of the area under the curve lies between and
- The curve is perfectly symmetric around
- The total area under the curve equals 1 (as with all probability density functions)
Mean and standard deviation of the standard normal distribution
From the symmetry of the graph, we can see that both the mean and median equal 0. The curve is centered at the origin.
Although we cannot find an exact integral for the standard normal probability density function, the symmetry allows us to verify that the mean is 0. When we split the integral for into two parts (from to 0 and from 0 to ), one integral is simply the negative of the other, so they cancel out.
For the variance and standard deviation, it can be shown through integration that:
Therefore:
Key Property of Standard Normal Distribution:
The standard normal distribution has mean and standard deviation . These specific values make it the "standard" reference distribution.
We use the symbol to represent the random variable with a standard normal distribution.
The general normal distribution
The normal distribution is not limited to cases where the mean is 0 and standard deviation is 1. We can create normal distributions with any mean μ and any positive standard deviation σ.
Transformations of the standard normal distribution
To obtain a normal distribution with mean and standard deviation from the standard normal distribution, we apply the following transformation:
This transformation consists of:
- A dilation by factor from the -axis
- A dilation by factor from the -axis
- A translation by units in the positive -direction (when )
Going in the reverse direction, we can transform from a general normal distribution back to the standard normal using:
This transformation:
- Translates by units in the negative -direction
- Dilates by factor from the -axis
- Dilates by factor from the -axis
Area-preserving property
Critical Property: Area Preservation
An important property of these transformations is that they preserve area. This means that corresponding regions under the two curves have equal areas, even though the shapes of the regions appear different.
This area-preserving property is crucial because it allows us to calculate probabilities for any normal distribution by converting to the standard normal distribution and using standard normal tables or technology.
For example, with and , a rectangle with area 180 square units in the general normal distribution corresponds to a rectangle with the same area in the standard normal distribution, just with different dimensions.
The general normal distribution formula
If is a normally distributed random variable with mean and standard deviation , then its probability density function is:
To find probabilities, we use the relationship:
where is the standard normal random variable.
The general normal distribution has two parameters:
- (mu): the mean of the distribution
- (sigma): the standard deviation of the distribution
These parameters completely determine the shape and position of the normal curve.
Properties of the normal distribution
All normal distributions share certain fundamental properties:
- Probability equals area: The probability of an event corresponds to the area under the curve
- Total area is 1: The total area under any normal curve equals 1
- Bell-shaped: The curve has a characteristic bell shape
- Symmetric: The curve is symmetric around its mean
Effect of the mean ()
The mean determines the location (center) of the curve. The curve is symmetric about the vertical line .
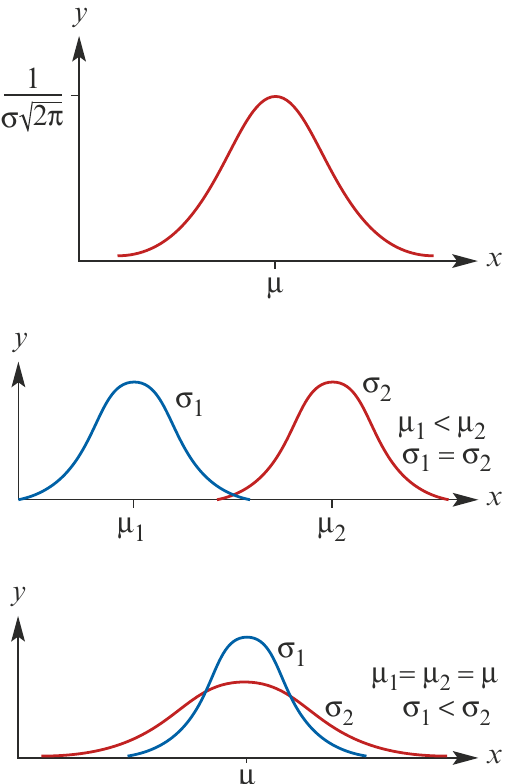
When we compare two normal distributions with the same standard deviation but different means:
- The shapes are identical
- The curves are centered at different positions along the -axis
- If , then the first curve is to the left of the second
Understanding μ's Role:
Think of as the "slider" that moves the entire distribution left or right along the number line. Changing doesn't change the shape of the curve—it only changes where the center sits.
Effect of the standard deviation ()
The standard deviation determines the spread (width) of the curve.
Key points about the effect of :
- The curve has a maximum value of at
- Larger σ means a wider, flatter curve
- Smaller σ means a taller, narrower curve
- When comparing distributions with the same mean but different standard deviations, all curves are centered at the same point but have different spreads
Consistent areas within standard deviations
The Empirical Rule:
Regardless of the values of and , the area under the curve within a given number of standard deviations from the mean is always the same percentage of the total area.
For example:
- Approximately 68% of the area lies within 1 standard deviation of the mean
- About 95% within 2 standard deviations
- About 99.7% within 3 standard deviations
This property holds for any normal distribution, making it a powerful tool for understanding probability.
Worked example
Worked Example: Sketching Normal Distributions
Problem: On the same set of axes, sketch the graphs of the probability density functions of the standard normal distribution and the normal distribution with mean 1 and standard deviation 2.
Solution:
The graph of the standard normal distribution has been dilated from the -axis by factor 2 and from the -axis by factor , then translated 1 unit in the positive direction of the -axis.
The two density functions are:
Standard normal:
General normal with and :
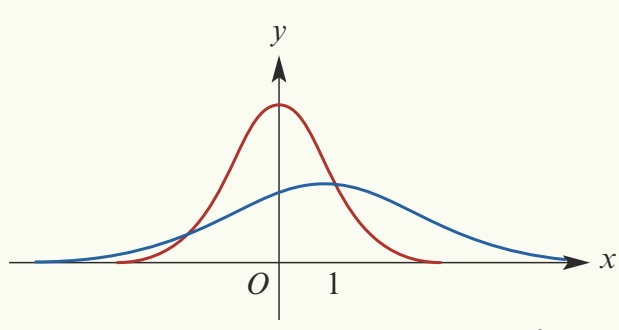
The sketch shows:
- The standard normal (taller, narrower) centered at
- The transformed normal (wider, flatter) centered at
- Both curves are bell-shaped and symmetric about their respective centers
Remember!
Key Points to Remember:
- The standard normal distribution has mean and standard deviation , with PDF:
- The general normal distribution with mean and standard deviation has PDF:
-
The mean μ determines location (where the curve is centered), while the standard deviation σ determines spread (how wide and flat the curve is)
-
All normal distributions are symmetric and bell-shaped, with total area under the curve equal to 1
-
We can convert any normal distribution to the standard normal using:
This conversion is essential for calculating probabilities using standard normal tables or technology.