Populations and Samples (VCE SSCE Mathematical Methods): Revision Notes
Populations and Samples
What is a population?
A population refers to the complete set of individuals or items that we want to study and learn about.
For instance, if we're interested in investigating the IQ scores of Year 12 students at ABC Secondary College, then all these students form our population. We could gather and examine the IQ scores for every student in this group. However, if we want to study the IQ scores of all Year 12 students throughout Australia, that broader group becomes our population.
Understanding Population Scope
The definition of a population depends entirely on the research question:
- Studying ABC Secondary College? Population = Year 12 students at that school
- Studying all of Australia? Population = All Year 12 students nationwide
The population changes based on what we're trying to learn about.
Why can't we always study entire populations?
Working with a complete population is often not practical for several reasons:
-
Size: The population might be too large. For example, studying every Year 12 student across Australia would involve examining hundreds of thousands of students.
-
Accessibility: The population may be difficult to reach. Consider trying to study all blue whales in the Pacific Ocean - locating and examining every individual would be virtually impossible.
-
Destructive testing: Sometimes data collection destroys what we're studying. For instance, if we tested every battery to see how long it lasts, there would be no batteries left to sell.
Despite these challenges, we often need to make conclusions about population characteristics even when we cannot examine every member.
What is a sample?
The solution is to select a sample - a smaller subset chosen from the population. By studying this sample carefully, we hope that our findings will also be true for the entire population from which it came.
Working with a sample offers several advantages:
- Faster data collection
- Lower costs
- More practical than examining everyone
However, the sample must be chosen thoughtfully. A well-selected sample provides valuable information about the population, whilst a poorly chosen sample can lead to incorrect conclusions.
Random sampling
The importance of random selection
Consider this scenario: we want to investigate how sustained computer use affects university students' eyesight. We enter a lecture theatre and select all students sitting in the front two rows as our sample.
Why This Sampling Method Fails
This approach is problematic because students with existing vision problems are more likely to sit near the front. Our sample would therefore not be typical of the whole student population, making any conclusions unreliable.
This illustrates a critical principle: convenience does not equal randomness.
To draw valid conclusions about a population from a sample, we need the sample to reflect the population's characteristics. This means different subgroups within the population should appear in the sample in similar proportions to how they appear in the population overall - we call this a representative sample.
How do we achieve random sampling?
The fundamental principle is that our selection method should not favour or disadvantage any subgroup within the population. Since bias isn't always obvious, we aim to give every member of the population an equal chance of being selected. This is achieved through random selection.
A sample of size is called a simple random sample if it is selected so that:
- Every subset of size has an equal chance of being chosen
- Every individual member has an equal chance of being included
One simple method for selecting a random sample from university students would be placing every student's name in a hat, then drawing out names one at a time until we have the required sample size.
Worked Example: Library Survey
Problem: A researcher wants to evaluate how well the local library meets the needs of a town's residents. She distributes a questionnaire to each person entering the library over one week. Will this method produce a random sample?
Analysis: This method has a significant flaw. The people being surveyed are already library users, so they may be satisfied with the available services. Important information could be missing - specifically, the opinions of residents who don't use the library.
Better approach: Select individuals at random from the town's entire population. This way, the sample includes both library users and non-users, providing a more complete picture of how well the library serves the community.
Generating random samples with technology
A practical method for selecting random samples involves using random number generators available on calculators and computers.
Using the TI-Nspire calculator
Follow these steps to generate random numbers:
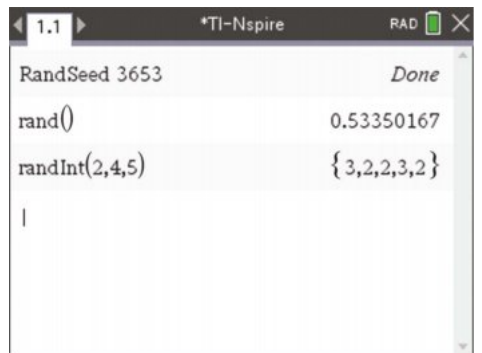
Setting the random seed:
- Open a Calculator page
- Navigate to Menu > Probability > Random > Seed
- Enter the last 4 digits of your phone number
- This ensures your random number sequence differs from the calculator's default
Generating random numbers:
- For a random decimal between 0 and 1: Menu > Probability > Random > Number
- For random integers: Menu > Probability > Random > Integer
Example: To obtain five random integers between 2 and 4 inclusive, use the command randInt(2, 4, 5).
Using the Casio ClassPad calculator
Accessing the catalog:
- In Main menu, press the Keyboard button
- Tap the down arrow at the bottom of the left sidebar to find Catalog
- Scroll to the letter R
Generating random decimals:
- In Catalog, select rand(
- Tap EXE to generate a number between 0 and 1
Generating random integers:
- In Catalog, select rand(
- Type: 1, 6) for integers between 1 and 6
- Tap EXE (repeat as needed for multiple values)
Generating lists of random numbers:
- For decimals: Select randList(, type the quantity (e.g., 10)), tap EXE
- For integers: Select randList(, type quantity and range (e.g., 20, 1, 30)), tap EXE
- Tap the arrow to view all generated numbers
Worked Example: Selecting Students with Random Numbers
Task: Use a random number generator to select a group of six students from this class of 20:
Denice, Matt, Teresa, Sue, Shanyn, Mark, Arnold, Nick, Miller, William, Lulu, Darren, Tom, David, Lacey, Janelle, Mike, Jane, Georgia, Jaimie
Solution:
First, assign a number to each student:
- Denice (1), Matt (2), Teresa (3), Sue (4)
- Shanyn (5), Mark (6), Arnold (7), Nick (8)
- Miller (9), William (10), Lulu (11), Darren (12)
- Tom (13), David (14), Lacey (15), Janelle (16)
- Mike (17), Jane (18), Georgia (19), Jaimie (20)
Generate six random integers from 1 to 20.
Suppose we obtain: 4, 19, 9, 2, 13, 14
The selected sample is: Sue, Georgia, Miller, Matt, Tom, David
Avoiding Duplicate Selections
When generating a list of random integers without repeats, we skip any number that has already appeared in our list. This ensures each population member can only be selected once.
Sample proportion as a random variable
Understanding population proportion
Let's continue with the class from the previous example. Suppose we're particularly interested in the proportion of female students.
The population proportion (denoted by ) represents the proportion of individuals in the entire population who possess a particular characteristic. This value is constant for a given population.
In our class of 20 students, there are 10 females, so:
Understanding sample proportion
Now consider the proportion of females in our selected sample: Sue, Georgia, Miller, Matt, Tom, David
The sample proportion (denoted by , pronounced "p hat") is calculated by dividing the number of individuals with the attribute by the sample size.
Our sample contains two females out of six students, so:
Population parameter versus sample statistic
Notice that differs from the population proportion . This is not a problem - it's expected behaviour. Different symbols are used to avoid confusion:
Key Distinction: Parameter vs Statistic
-
The population proportion is a population parameter: its value is fixed and constant for a particular population
-
The sample proportion is a sample statistic: its value is not constant, but varies from sample to sample
Think of it this way:
- = population parameter (constant)
- = sample statistic (varies)
Each time we select a new random sample, the number of females will likely change, causing to vary. Sometimes it will equal , and sometimes it won't.
Worked Example: Comparing Sample Proportions
Task: Use a random number generator to select another group of six students from the same class, and determine the proportion of females in this new sample.
Using the same numbering system as before (Denice = 1, Matt = 2, Teresa = 3, etc.)
Solution:
Generating six random integers from 1 to 20 gives: 19, 3, 11, 9, 15, 1
The selected sample is: Georgia, Teresa, Lulu, Miller, Lacey, Denice
This sample contains five females out of six students, so:
This value differs from our first sample proportion of , demonstrating how varies between samples.
Sample proportion as a random variable
Because varies according to which random sample is selected, we can treat sample proportions as values of a random variable, denoted by . This concept becomes important when we want to understand the behaviour of sample proportions across many possible samples.
The distinction between (a specific calculated value) and (the random variable) mirrors the relationship between individual data values and the variable that generates them. Just as we might roll a die multiple times and get different values, we can take multiple samples and get different sample proportions.
Key Points to Remember
-
A population is the complete group we want to study, whilst a sample is a smaller subset selected from it
-
Simple random sampling ensures every member of the population has an equal chance of selection, helping to create representative samples
-
The population proportion is a fixed parameter, whilst the sample proportion is a statistic that varies between samples
-
Representative samples are essential for making valid conclusions about populations
-
Random number generators on calculators provide practical tools for selecting random samples
-
Remember the distinction: (parameter, constant) versus (statistic, varies)