Collecting Data (VCE SSCE Physics): Revision Notes
Collecting Data
Introduction
Gathering high-quality data is essential in scientific investigations. When data collection is done poorly, it can lead to invalid conclusions and costly mistakes. To avoid these problems and ensure valid results, scientists must carefully consider precision, accuracy, errors, and uncertainty throughout their experiments.
The quality of your data determines the quality of your conclusions. Even brilliant analysis cannot rescue an experiment with poorly collected data.
Precision, accuracy, and resolution
What is precision?
Precision tells us how well a set of measurements agree with each other. Think of it as a measure of consistency - if you take multiple measurements of the same thing, how similar are they?
When measurements are more precise, they have a smaller spread or range. A larger range indicates less precise measurements. Importantly, precision is a relative indicator, meaning we can only say one set of measurements is more or less precise compared to another set, not that it is objectively "precise".
What is accuracy?
Accuracy tells us how close a measurement is to the 'true' value. The 'true' value is what we would measure if we could take measurements with absolutely no errors at all.
Like precision, accuracy is also a relative indicator. We can only compare the accuracy of different measurements - we cannot say a measurement is objectively "accurate" on its own.
How are precision and accuracy different?
Precision and accuracy measure different aspects of data quality. A helpful way to understand the difference is to imagine shooting arrows at a target, where the bullseye represents the true value.
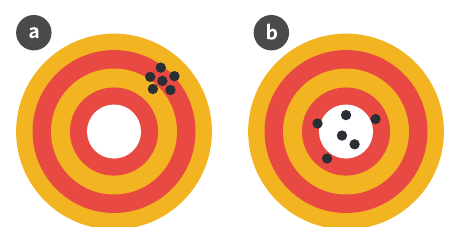
- High precision means your measurements are closely grouped together (small spread), even if they're not near the true value. This is like arrows consistently hitting the same area of the target.
- High accuracy means your measurements are close to the true value on average, even if individual measurements vary widely. This is like arrows scattered around the bullseye.
Key Distinction: Precise measurements aren't necessarily accurate, and accurate measurements aren't necessarily precise. You need to consider both when assessing data quality.
Think of it this way: Precision = Points close together, Accuracy = Aiming at the center
Categorising measurements
By combining precision and accuracy, we can categorise any set of measurements into four groups:
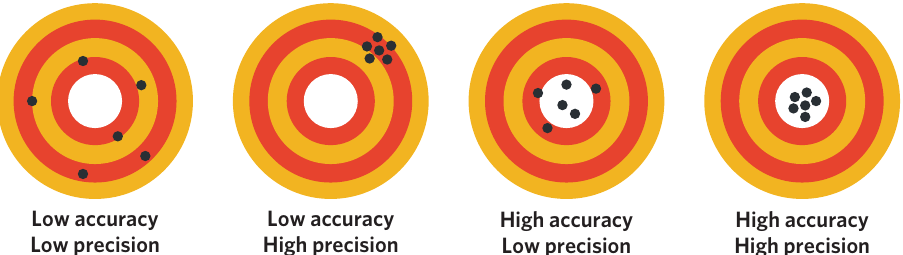
- Low accuracy, low precision: Measurements are spread out and far from the true value
- Low accuracy, high precision: Measurements are tightly grouped but consistently away from the true value
- High accuracy, low precision: Measurements are scattered but centred around the true value
- High accuracy, high precision: Measurements are tightly grouped around the true value (this is ideal!)
What is resolution?
Resolution is the smallest change in a quantity that a measuring instrument can detect. The finer the resolution, the more precisely you can make measurements, and the less uncertainty your recorded values will have.
For example, consider two stopwatches:
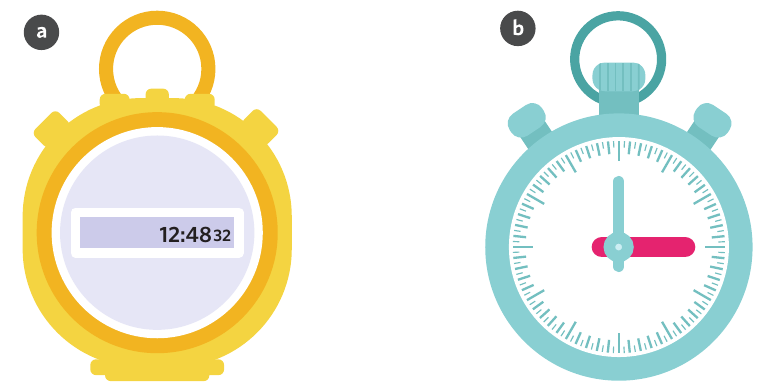
- A digital stopwatch with resolution of can detect changes as small as one hundredth of a second
- An analogue stopwatch with resolution of can only detect changes of half a second or more
The digital stopwatch has higher resolution, allowing for measurements with greater certainty.
Exam Tip: The resolution of a measuring instrument is typically half the smallest marked interval. For example, a ruler marked in millimetres has a resolution of .
Error and uncertainty
No experimental data is ever perfectly accurate. Various types of errors occur during data collection, and these errors create uncertainty in our measurements. Understanding these errors helps us minimise their impact and assess the reliability of our results.
What are the different types of errors?
There are three main categories of error that can affect experimental data: systematic, personal, and random errors.
Systematic errors
Systematic errors cause all measurements to deviate from the true value by a consistent amount in the same direction. These errors uniformly affect the accuracy of data.
Common examples of systematic errors include:
- Uncalibrated equipment: A weighing scale that consistently reads too high will make all mass measurements inaccurate by the same amount
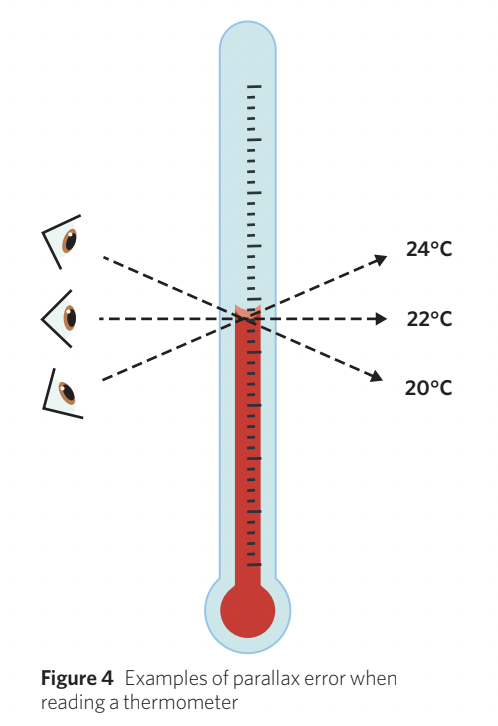
- Parallax error: Reading an analogue scale (like a thermometer or ruler) at an angle rather than straight-on causes consistent misreadings
To reduce systematic errors, you should:
- Calibrate all equipment before conducting the experiment
- Carefully analyse your experimental method to identify potential sources of systematic error
- Take readings at eye level to avoid parallax error
Critical Point About Averaging: Because systematic errors affect all measurements by the same amount, averaging multiple readings will NOT improve accuracy. The average will still be shifted away from the true value by the systematic error.
Personal errors
Personal errors are mistakes made during an experiment or data analysis due to lack of care. These errors can negatively impact or completely invalidate experimental conclusions.
Example: Personal Error
Misreading a thermometer scale because you weren't paying attention, recording when it actually showed , is a personal error. This isn't a limitation of the equipment or method - it's simply a mistake.
Unlike other errors, data points affected by personal errors should NOT be included in your analysis or report, as they represent mistakes rather than measurement limitations.
Random errors
Random errors are unpredictable variations that occur when measuring quantities. While they can be reduced, they cannot be entirely eliminated.
Random errors arise from:
- Reading between the marked intervals on a measuring device (you must estimate the reading)
- Taking measurements from fluctuating displays
- Uncontrolled variations in experimental conditions between trials
To reduce random error:
- Choose equipment that produces less variation in readings
- Take multiple measurements and calculate the average (this improves accuracy by cancelling out random fluctuations)
Visualising errors with targets
The target analogy helps us understand the difference between systematic and random errors:
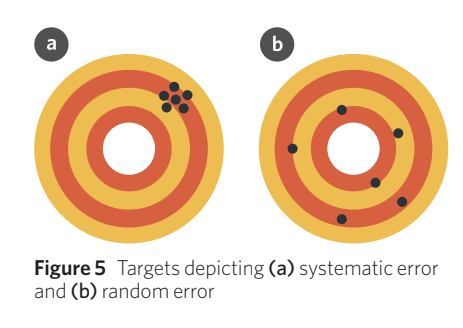
- Systematic error: All arrows (data points) are shifted in the same direction away from the bullseye. The shots remain grouped together (still precise) but miss the target (inaccurate).
- Random error: Arrows are scattered randomly around the target. Some may be close to the bullseye, others far away (imprecise).
Identifying errors in plotted data
When you plot experimental data on a graph, different error types create different patterns. Understanding these patterns helps identify what went wrong.
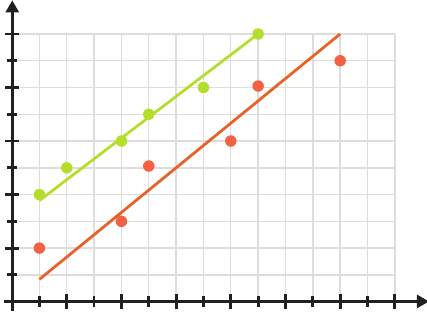
Consider a graph where the true relationship between variables is shown by the orange line:
- Systematic error often appears as a trend line with the wrong y-intercept. In the example shown, the green line has a non-zero y-intercept when it should pass through the origin, indicating all measurements were shifted by a consistent amount.
- Random error appears as scatter in the data points around the trend line. Points that don't sit exactly on the line (like the orange points in the figure) indicate random error affected those measurements differently.
Exam Tip: In your experimental reports, you should discuss any sources of error that you couldn't remove or didn't identify during the experiment. This shows scientific awareness and improves the validity of your conclusions.
Understanding uncertainty
Uncertainty quantifies the range within which the true value of a measurement should lie. Every measurement has some uncertainty because no measuring instrument is perfectly precise.
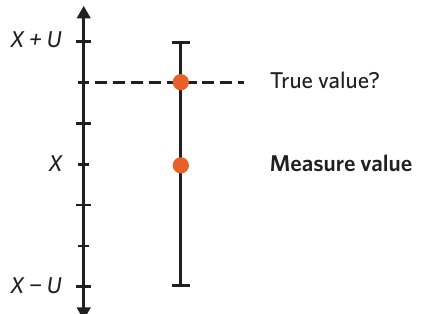
Uncertainty is typically expressed in the form:
Example: Expressing Uncertainty
If you measure a length three times and get an average of , and your ruler has an uncertainty of , you would write:
This means the true value lies somewhere in the range to .
Uncertainty can also be shown as error bars on graphs (covered in more detail in lesson 12D).
How to reduce uncertainty:
- Use measuring instruments with higher resolution (finer markings)
- Choose instruments with smaller measurement intervals
For example, using a ruler marked in millimetres rather than centimetres reduces uncertainty because you can read values more precisely.
For VCE Physics: You need to be able to recognise uncertainty in the form , draw uncertainty bars on graphs, and state the uncertainty shown by error bars. The uncertainty of a measuring device is calculated as half the smallest measuring increment.
Validity, repeatability, reproducibility, and logbooks
What makes an experiment valid?
An experiment is valid if it successfully measures what it aims to measure. Validity can be compromised at any stage of an experiment - before, during, or after conducting it.
The table below summarises key requirements for validity at each stage:
| Time period | Elements necessary for validity |
|---|---|
| Before the experiment | - The experiment changes only one independent variable at a time and measures one dependent variable - No variables other than the independent variable are changed - The experiment is designed to minimise errors and uncertainties - All necessary assumptions for analysis are addressed in the experimental design |
| During the experiment | - No controlled variables are allowed to change - All steps of the scientific method are followed - The experiment measures the correct dependent variable - Appropriate equipment is used to minimise errors and uncertainties - Observer bias is minimised - An accurate, chronological logbook documenting the experimental process and results is maintained |
| After the experiment (data analysis) | - All data is included and explained - data cannot be arbitrarily selected to produce desired trends - Any outliers are addressed in the discussion and included in the initial data - Results are examined carefully - correlation between variables is not automatically assumed to mean causation |
Common Mistake - Correlation vs Causation:
Just because two variables are related (correlation) doesn't mean one causes the other to change (causation). Both could be affected by a third variable! Always examine whether there's a causal mechanism linking the variables before claiming causation.
Repeatability vs reproducibility
While these terms sound similar, they measure different aspects of experimental reliability:
Repeatability refers to how closely results match the original experiment when:
- The same experimenter repeats the experiment
- Using the same equipment
- In the same laboratory
- Under the same conditions
Essentially, repeatability measures precision when everything is kept as similar as possible.
Reproducibility refers to how closely results match the original experiment when:
- A different experimenter repeats the experiment
- Using their own equipment
- In their own laboratory
- Under slightly different conditions
Reproducibility tests whether the results hold up when conditions vary slightly - this is a stronger test of the experiment's reliability.
Both repeatability and reproducibility relate to the precision of results - how closely repeated measurements agree with each other. The key difference is whether conditions are kept identical (repeatability) or allowed to vary slightly (reproducibility).
Why do we need a logbook?
A logbook is your complete, chronological record of everything that happens during an experiment. It serves as both a planning tool and a permanent record that other scientists can review.
A good logbook should contain:
- A table of contents for easy navigation
- Entries in chronological order with dates and times recorded
- Detailed information about the experimental method
- Records of any mistakes or errors that occurred
- Sketches or diagrams of the apparatus used
- All experimental data with notes on how it was collected
- All working and calculations for data transformations
- Discussion of results and conclusions drawn
- Any other information useful for someone wanting to reproduce your experiment
Why logbooks matter for validity:
Logbooks are essential for assessing experimental validity because they:
- Allow other experimenters to compare their results with yours to assess reproducibility
- Let you compare your own repeated experiments to determine repeatability
- Provide a complete record to identify where errors may have occurred
- Document controlled variables to confirm the experiment was valid
- Create transparency in the scientific process
Exam Tip: Think of your logbook as a conversation with your future self and other scientists. Write down everything you'd need to know to repeat the experiment exactly, including things that went wrong!
Remember!
Key Points to Remember:
-
Precision measures how closely measurements agree with each other (small range = high precision), while accuracy measures how close measurements are to the true value. These are relative, not absolute, measures.
-
Resolution is the smallest change a measuring instrument can detect. Higher resolution means lower uncertainty in measurements.
-
Three types of errors affect experiments differently: systematic errors cause consistent deviations in one direction (reduced by calibration), personal errors are mistakes from carelessness (data should be excluded), and random errors cause unpredictable variations (reduced by averaging).
-
Uncertainty can be reduced by using instruments with finer resolution. It is expressed as or shown with error bars on graphs.
-
An experiment is valid if it measures what it intends to measure. Validity requires careful attention before (design), during (execution), and after (analysis) the experiment.
-
Repeatability (same experimenter, same conditions) and reproducibility (different experimenter, different conditions) both assess whether results can be reliably obtained again. Logbooks support both by providing complete experimental records.