Communicating Findings (VCE SSCE Physics): Revision Notes
Communicating Findings
Introduction to scientific communication
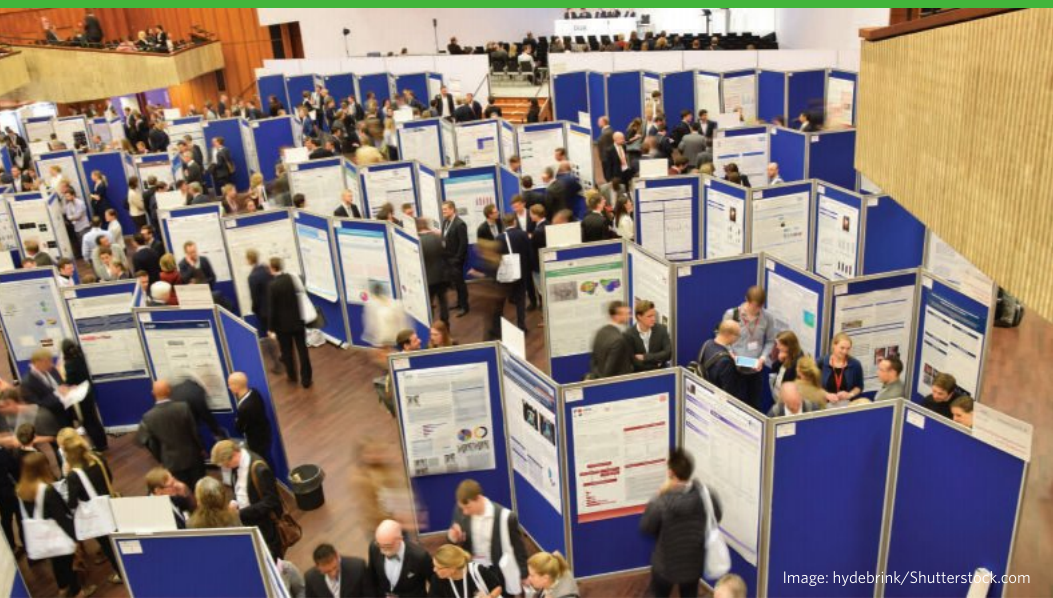
A fundamental aspect of scientific investigation is sharing your findings with others. When you complete an experiment, it's not enough to simply record your results in a notebook - the scientific community values transparency and reproducibility. One of the most effective ways to communicate your investigation is through a scientific poster.
A scientific poster serves as a complete record of your investigation. It should contain all the information someone else would need to understand your work, recreate your experiment, and evaluate your conclusions. This commitment to reproducibility is a cornerstone of scientific practice.
Scientific posters are valuable tools for presenting research at conferences, in classrooms, and in professional settings. They allow researchers to share their work with a broad audience and receive feedback from peers.
Purpose of a scientific poster
A well-constructed scientific poster achieves several important goals:
- It clearly communicates your research question and why it matters
- It provides enough detail for others to replicate your investigation
- It presents your data in an accessible, visual format
- It explains your findings and their significance to the broader field of physics
- It acknowledges sources of information and inspiration
The key is to be both comprehensive and concise. Every section should serve a clear purpose in telling the story of your investigation from start to finish.
Structure of a scientific poster
Scientific posters follow a standard structure that helps readers navigate your work efficiently. The layout is organized to guide the reader through your investigation in a logical sequence.
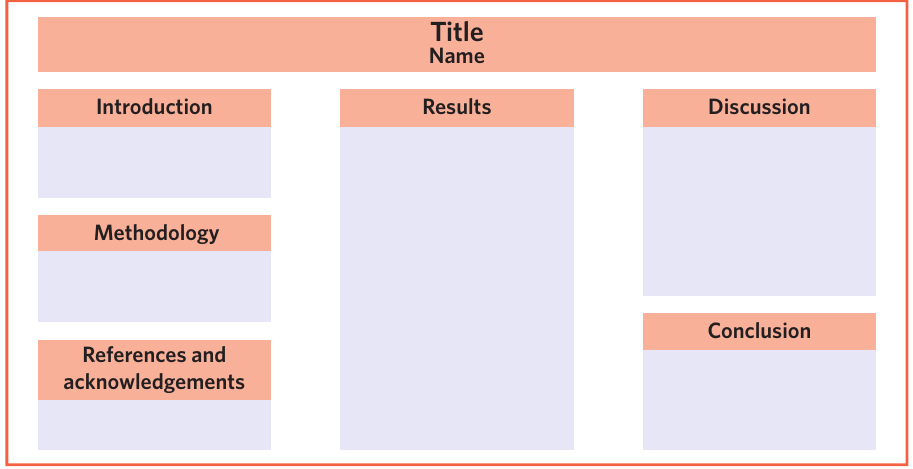
Understanding the Layout
The poster typically includes seven main sections, arranged to allocate space proportionally to the importance and detail required for each part. The title and author name sit prominently at the top. The left column usually contains your introduction, methodology, and references. The centre section showcases your results, as this is often the most visually important part. The right column presents your discussion and conclusion.
This layout isn't arbitrary - it reflects the natural flow of scientific thinking from question to answer, and from specific observations to general understanding.
Title section
The title of your poster should immediately tell readers what your investigation is about. Rather than using a vague label, phrase your title as a research question. This approach clearly identifies the relationship you're investigating.
Example: Effective vs Ineffective Titles
❌ Ineffective: "Investigation of Inclined Planes"
- Too vague
- Doesn't specify what's being investigated
- Gives no information about variables
✓ Effective: "How does changing the angle of inclination of a plane affect the time it takes for a ball to travel down it?"
- Clear research question format
- Identifies both variables (angle and time)
- Sets clear expectations for the investigation
Below the title, include your name (and the names of any collaborators). This provides proper attribution for the work.
Introduction section
The introduction sets the theoretical foundation for your investigation. It should accomplish three main tasks: provide background information, define key terms and present relevant formulas, and state your aim and hypothesis.
Background information
Begin by explaining the physics concepts that underpin your investigation. This contextualises your experiment within established scientific knowledge. For the inclined plane example, you would explain how the angle affects the force components:
As the angle of inclination increases, the component of gravitational force acting down the plane increases. This component can be calculated using , where is the mass of the object, is gravitational acceleration, and is the angle of inclination.
You would then connect this to Newton's second law () to explain that a greater force component produces greater acceleration. Finally, link this to the kinematic equation to show why greater acceleration means less time to travel the same distance.
Key definitions
The Importance of Clear Definitions
Define any technical terms that are central to your investigation. Write these definitions in clear, accessible language. Never assume your reader knows specialized terminology - even if they're familiar with the concepts, clear definitions demonstrate your understanding.
For example:
Angle of inclination: the angle a ramp makes to the horizontal surface.
Relevant formulas
List the main equations you'll use in your investigation and analysis. For the inclined plane example:
Aim and hypothesis
Conclude your introduction by stating what you set out to investigate (the aim) and what you predicted would happen (the hypothesis). The aim identifies your research question, while the hypothesis provides your testable prediction based on the background theory you've explained.
Methodology section
The methodology section explains how you conducted your investigation. Someone reading this section should be able to replicate your experiment exactly. This requires three components: a materials list, a visual representation of your setup, and a step-by-step procedure.
Materials list
Provide a complete inventory of everything needed for the investigation. Be specific about quantities and types. For the inclined plane investigation:
- 1 × 75 cm plank of wood
- 1 × small bouncy ball
- 1 × stack of books
- 1 × protractor
- 1 × stopwatch
Experimental setup
Include a labelled diagram or photograph showing how you arranged your equipment. This visual reference is crucial because it immediately shows spatial relationships that might be difficult to describe in words alone.
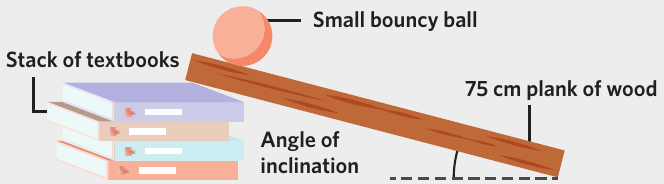
Every element in your diagram should be clearly labelled. In this example, the diagram shows the wooden plank propped up by textbooks, the ball's starting position, and how the angle of inclination is measured. Sequential numbering (e.g., "Figure 2") helps readers reference specific diagrams when discussing results.
Procedure
Using Third Person in Scientific Writing
Write your procedure in third-person imperative form rather than first-person narrative. This means writing "Adjust the number of books" rather than "I adjusted the number of books."
This convention maintains an objective, professional tone and keeps focus on the science rather than the scientist. It also makes the procedure more universally applicable - it becomes a set of instructions anyone can follow rather than a personal narrative.
Worked Example: Writing a Procedure
For the inclined plane investigation, each step should be specific and actionable:
- Lean the ramp on a stack of books
- Adjust the number of books until the ramp makes an angle of 30° to the horizontal
- Place the ball at the top of the ramp and release it
- Record the time taken for the ball to reach the bottom
- Repeat steps 3-4 two more times and calculate the average
- Increase the angle to 40° by adding more books
- Repeat steps 3-5 for this new angle
- Continue for angles of 50°, 60°, and 70°
Each step is written in third person and provides enough detail that someone unfamiliar with the investigation could follow it successfully.
Results section
The results section presents the data you collected during your investigation. This is typically the most visually prominent part of your poster, as it contains the empirical evidence supporting your conclusions.
Presenting data
Display your raw data in a format that makes patterns and relationships clear. For many investigations, a graph is more effective than a table because it allows readers to immediately visualise trends. However, a table might be appropriate if you have a small dataset or if exact values are more important than overall trends.
Avoiding Data Duplication
Don't include both a table and a graph of the same data, as this wastes valuable poster space. Choose the format that best communicates your findings. If you use a graph, you can reference specific values in your text without repeating them in table form.
For the inclined plane investigation, a graph plotting time against angle of inclination effectively shows the relationship between variables:
| Angle of Inclination (°) | Time (s) |
|---|---|
| 10 | 1.5 ± 0.1 |
| 20 | 1.1 ± 0.1 |
| 30 | 0.8 ± 0.1 |
| 40 | 0.6 ± 0.1 |
| 50 | 0.5 ± 0.1 |
The graph should include proper labels, units, a line of best fit, and error bars to show measurement uncertainty. Number it sequentially (e.g., "Figure 3") and include a descriptive caption.
Key features of results
After presenting your data, briefly highlight the main patterns or trends. For the inclined plane example:
- The graph shows that increasing the angle of inclination of the plane reduces the time it takes the ball to reach the end of the plank
- The relationship appears approximately inverse, with time decreasing as angle increases
- Error bars show relatively small uncertainty in time measurements, suggesting reliable data collection
Evaluating data quality
Comment on whether your results are useful for drawing conclusions. Consider factors like:
- Is there a clear pattern or trend?
- Are measurements consistent (low random error)?
- Do data points follow the expected relationship?
For this investigation, you might note: "The results from this experiment appear to be useful, as the graph shows a clear relationship between the angle of inclination of the plane and the time it takes for the ball to roll down it."
Hypothesis support
Make an initial assessment of whether your data supports your hypothesis. This isn't a full analysis (that comes in the discussion), but rather a preliminary observation: "This observation supports the hypothesis of the investigation, that increasing the angle of inclination of the plane will decrease the time it takes for the ball to reach the bottom of it."
Discussion section
The discussion section is where you interpret your results and explain their significance. This goes beyond simply describing what happened - you need to analyse why it happened and what it means. The discussion is distinguished from the results section by its focus on explanation and evaluation rather than presentation.
Extent of hypothesis support
Scientific Language: "Supports" vs "Proves"
Use precise language when discussing your results. Say whether the data "supports", "partially supports", or "does not support" your hypothesis.
Avoid absolute terms like "proves" or "disproves" because scientific investigations deal with evidence and probability, not absolute certainty. Science builds confidence through repeated investigations and converging evidence, not through single definitive proofs.
For the inclined plane investigation: "The data from the investigation supports the hypothesis that increasing the angle of inclination of the plane will decrease the time it takes for the ball to reach the bottom of it. Each increase in the angle of inclination of the plane led to a decrease in the time it took for the ball to roll down it."
Comparison with theoretical predictions
Where possible, compare your experimental results with theoretical predictions. This helps evaluate the accuracy of your measurements and identify systematic errors.
For this investigation, you could calculate theoretical values using the formula:
Plot these theoretical values on the same graph as your experimental data. This allows readers to see how closely your results match theoretical expectations.
You might note: "The experimental data appears to have longer times for the ball to roll down the ramp than theoretical predictions. This is likely due to the effects of friction, which decrease the acceleration of the ball down the plane."
Error analysis
Types of Errors to Consider
Discuss potential sources of error in your investigation. Consider both:
- Random errors: which cause scatter in data (e.g., reaction time variations)
- Systematic errors: which cause consistent bias (e.g., miscalibrated equipment)
For each error source, explain what caused it, how it might have affected your results, and how it could be minimized in future investigations.
Worked Example: Error Analysis
For the inclined plane investigation:
Random Errors: "Reaction time when using the stopwatch would have added random error to time measurements. This is evident from the error bars on the graph, which show variation in repeated measurements at each angle."
Improvement: "Using automated timing gates would eliminate this error source and provide more precise measurements."
Systematic Errors: "Friction between the ball and the ramp surface would systematically increase all measured times compared to theoretical predictions. This explains why experimental values are consistently higher than calculated values."
Improvement: "Using a smoother surface or a rolling ball with minimal friction would reduce this systematic error."
Linking to broader concepts
Use the discussion to move from the specifics of your investigation to general physics principles. How do your findings illustrate or confirm established theories? What do they reveal about the underlying physics?
This is where you demonstrate understanding of how your particular investigation connects to the wider field of physics. For the inclined plane example, you might discuss how your results demonstrate the relationship between force components, acceleration, and motion that Newton's laws predict.
Conclusion section
The conclusion brings your investigation to a close by summarising what you found and what it means. Think of this as answering the question posed in your title, then reflecting on the investigation's limitations and future directions.
Main findings
State your key experimental finding and whether it supported your hypothesis. Be specific - reference particular patterns or trends in your results.
For example: "The experiment's results show that increasing the angle of inclination of the plane will decrease the time it takes for the ball to reach the bottom of it. This supports the experiment's hypothesis, that increasing the angle of inclination of the plane will decrease the time it takes for the ball to reach the bottom of it."
Notice how this directly answers the research question from the title and explicitly states the relationship found between variables.
Limitations and improvements
Demonstrating Scientific Maturity
No investigation is perfect. Identifying specific limitations of your study and suggesting concrete improvements shows scientific maturity and critical thinking. It demonstrates that you understand the constraints of your investigation and can think about how to strengthen the evidence.
For the inclined plane investigation: "The data is limited in the number of different angles of inclination used to test the hypothesis. The experiment could be improved by taking more data points for different angles of inclination. Additionally, using automated timing gates instead of manual timing would reduce measurement uncertainty."
Future research
Suggest how your investigation could be extended or what related questions could be explored. This demonstrates understanding of your work's place within broader scientific inquiry.
For example: "Future research could be undertaken to investigate how increasing the angle of inclination of the plane will decrease the time it takes for the ball to reach the bottom of it, with different balls used or different materials used to create the inclined plane. This would help determine whether the relationship holds for different masses and friction coefficients."
References and acknowledgements section
The final section of your poster acknowledges the sources of information and support that contributed to your work. This is both an ethical requirement (giving credit where it's due) and a practical one (allowing readers to explore topics further).
Referencing sources
Any information you used to develop your understanding or design your investigation should be referenced. This includes:
- Textbooks and scientific papers you consulted
- Online resources that explained relevant concepts
- Previous studies that inspired your investigation
- Theoretical frameworks you applied
You can use any standard referencing style (APA, Harvard, Chicago, etc.), but be consistent throughout your poster. The important thing is to provide enough information for readers to locate your sources.
Acknowledgements
If you received help or support, acknowledge it here. This might include:
- Teachers or mentors who guided your work
- Peers who assisted with data collection
- Institutions that provided equipment or facilities
- Funding sources that made the investigation possible
Proper acknowledgement demonstrates integrity and gives credit to those who contributed to your success.
Key conventions for scientific poster writing
Essential Conventions to Follow
Throughout your poster, observe these important conventions:
Use third person: Write in third person rather than first person. Say "The ramp was adjusted" rather than "I adjusted the ramp." This maintains an objective, professional tone and keeps focus on the science rather than the scientist.
Be concise: Posters have limited space. Every word should serve a purpose. Use bullet points, short paragraphs, and clear headings to make information accessible at a glance.
Number figures sequentially: All diagrams, graphs, and tables should be numbered (Figure 1, Figure 2, etc.) and include brief, descriptive captions. This allows you to reference them easily in your text.
Use cautious language about conclusions: Scientific conclusions are probabilistic, not absolute. Use terms like "supports" or "is consistent with" rather than "proves." Similarly, use "does not support" rather than "disproves."
Present formulas clearly: Display mathematical equations prominently, using proper mathematical notation. Define all variables the first time they appear.
Include units: Always include appropriate units when presenting data, whether in tables, graphs, or text. Physics without units is meaningless.
Remember!
Key Takeaways for Scientific Posters
-
A scientific poster communicates your entire investigation, from research question through to conclusions, in a visual and accessible format
-
The seven essential sections are: Title (as a research question), Introduction (background and hypothesis), Methodology (materials and procedure), Results (data presentation), Discussion (interpretation and error analysis), Conclusion (summary and future directions), and References (acknowledgement of sources)
-
Use third-person language in your methodology, write procedures that others could follow, and number all figures and tables sequentially
-
Present data in the most effective format (usually graphs rather than tables) and always include error bars to show measurement uncertainty
-
In your discussion, analyse errors and compare experimental results with theoretical predictions - this demonstrates deep understanding
-
Use language like "supports" rather than "proves" when discussing how results relate to your hypothesis, reflecting the probabilistic nature of scientific evidence
-
A good poster balances comprehensive information with concise presentation, making your investigation accessible to others in the scientific community