pH Curves (AQA A-Level Chemistry): Revision Notes
📚 Revision Notes
5.6.4 pH Curves
Types of pH Curves
There are four primary types of pH curves, each shaped by the combination of acids and bases used. Recognising these curves is essential for interpreting titration results accurately.
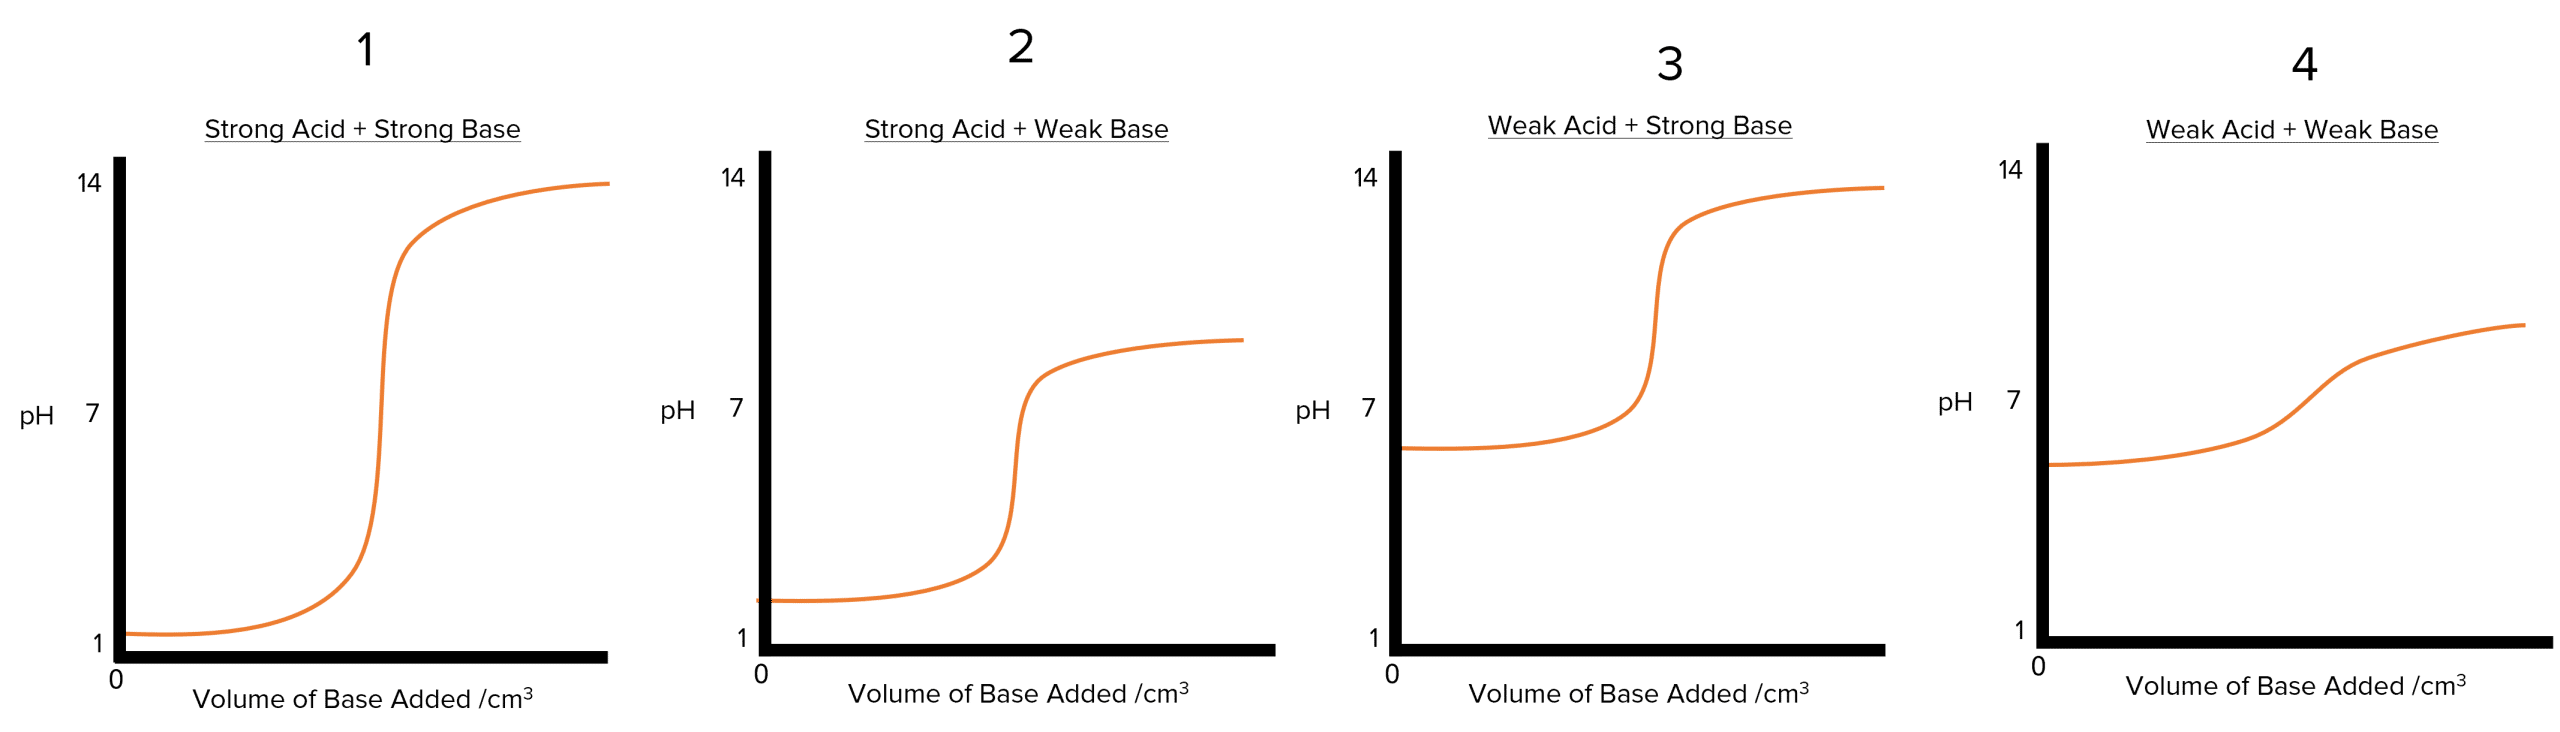
- Strong Acid with Strong Base: The pH starts low (acidic) and increases sharply near the equivalence point, finishing in a basic range.
- Strong Acid with Weak Base: The curve starts low, with a moderate pH increase and a smaller, gradual shift around the equivalence point.
- Weak Acid with Strong Base: The pH starts higher (weakly acidic) and rises gradually, with a less steep change at the equivalence point.
- Weak Acid with Weak Base: The pH change around the equivalence point is very gradual, and the solution does not reach strong acidic or basic levels.
Determining Acid or Base Added
- If the pH at the start is below 7, a base is being added to an acid.
- If the pH at the start is above 7, an acid is being added to a base.
Equivalence Point and Indicator Selection
The equivalence point depends on the acid and base used:
- Strong Acid–Strong Base: Equivalence point near pH 7, suitable for most indicators.
- Weak Acid–Strong Base: Equivalence point above pH 7; phenolphthalein is preferred.
- Strong Acid–Weak Base: Equivalence point below pH 7; methyl orange is suitable. Understanding curves and choosing the correct indicator ensures accurate endpoint detection.
Plotting pH Curves in Experiments
You can plot pH curves to visualise how pH changes during a titration.
To do this:
- Use a pH meter to record the initial pH of the solution.
- Add the titrant in small increments, recording the pH after each addition.
- Plot the pH against the volume added to reveal the titration curve and identify the equivalence point.