Energy Level Diagrams (AQA A-Level Chemistry): Revision Notes
1.6.3 Energy Level Diagrams
An energy level diagram visually represents the enthalpy changes that occur during a chemical reaction. It shows the relative energy of the reactants, products, and any transition states or intermediates that may occur.
The enthalpy change () represents the energy difference between the reactants and the products. It can be either:
- Endothermic: Energy is absorbed from the surroundings, and is positive.
- Exothermic: Energy is released to the surroundings, and is negative.
Features of Energy Level Diagrams
Reactants and Products
- The vertical axis shows the energy levels.
- Reactants are placed on the left side and products on the right side.
- The relative heights of the reactants and products determine if the reaction is exothermic or endothermic.
Activation Energy (Ea)
- Activation energy is the minimum energy required to start a reaction.
- It is represented by a peak between the reactants and the products.
- The height of this peak indicates how much energy is needed to break the initial bonds and begin the reaction.
Exothermic Reaction
- In an exothermic reaction, the products are at a lower energy level than the reactants.
- The difference in height represents the energy released.
- is negative because energy is released to the surroundings.
Endothermic Reaction
- In an endothermic reaction, the products are at a higher energy level than the reactants.
- The energy absorbed from the surroundings results in being positive.
Visualising Exothermic and Endothermic Reactions
Exothermic Reaction Diagram
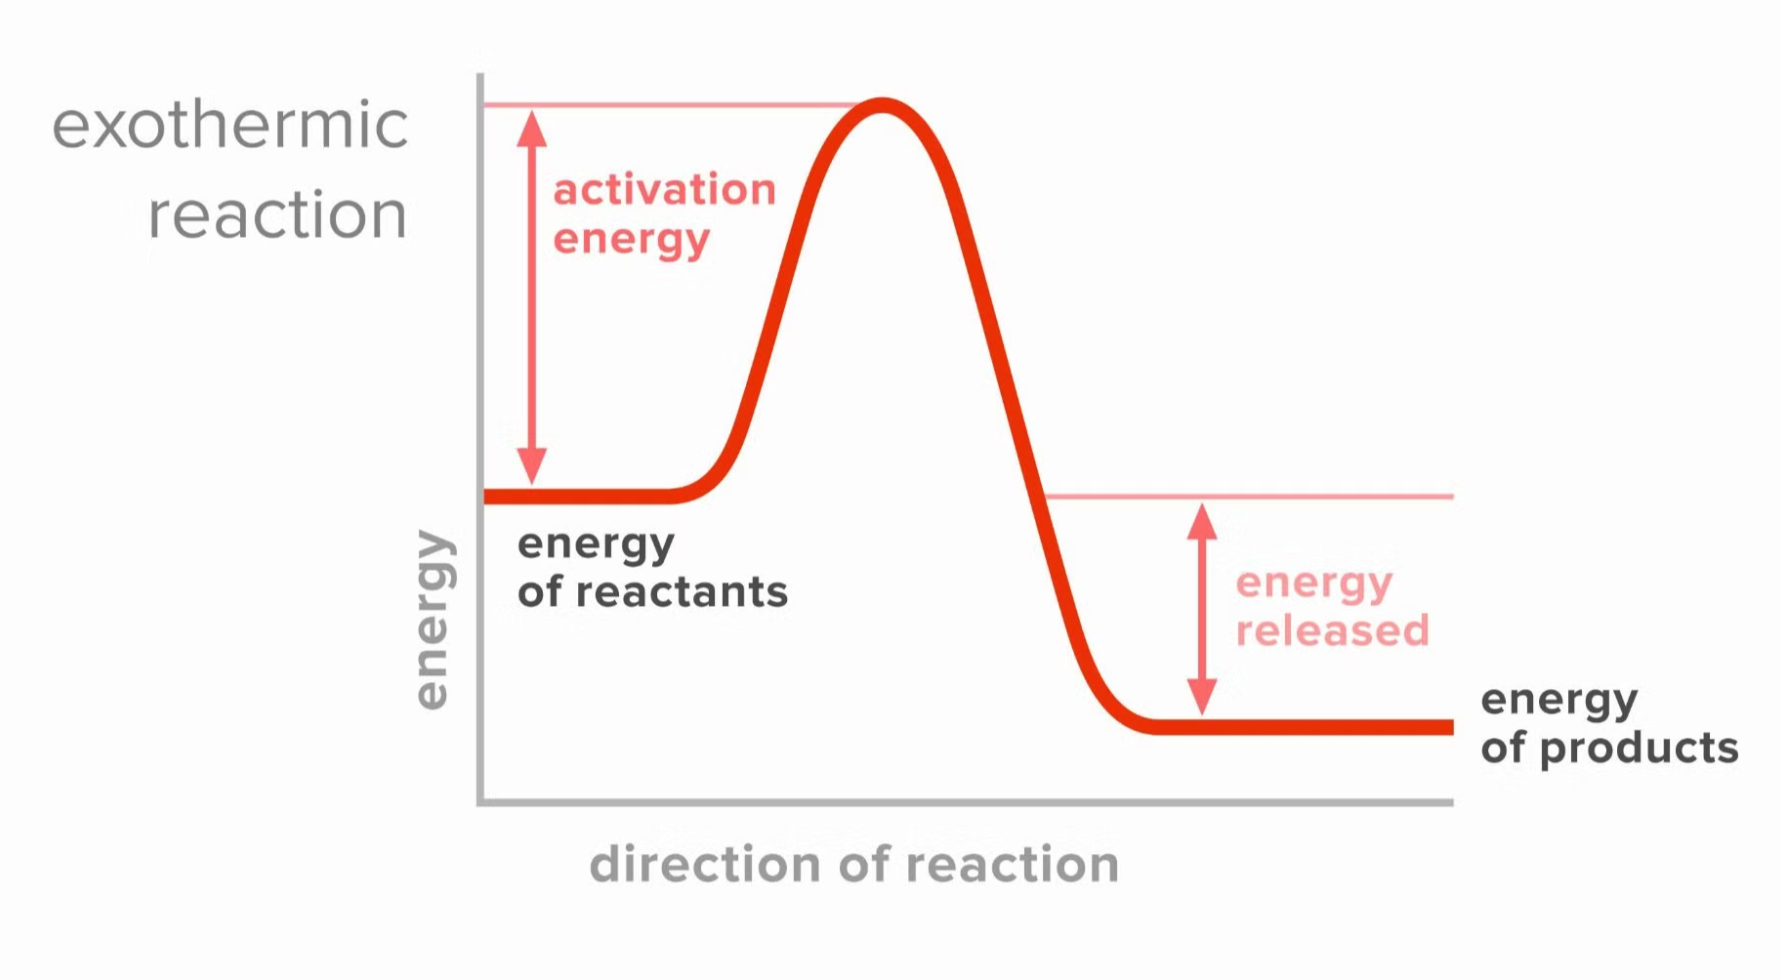
- Initial state: Reactants start at a higher energy level.
- Transition state: A peak (representing the activation energy) is reached, showing the energy required to initiate the reaction.
- Final state: Products are at a lower energy level, indicating that energy has been released.
Endothermic Reaction Diagram
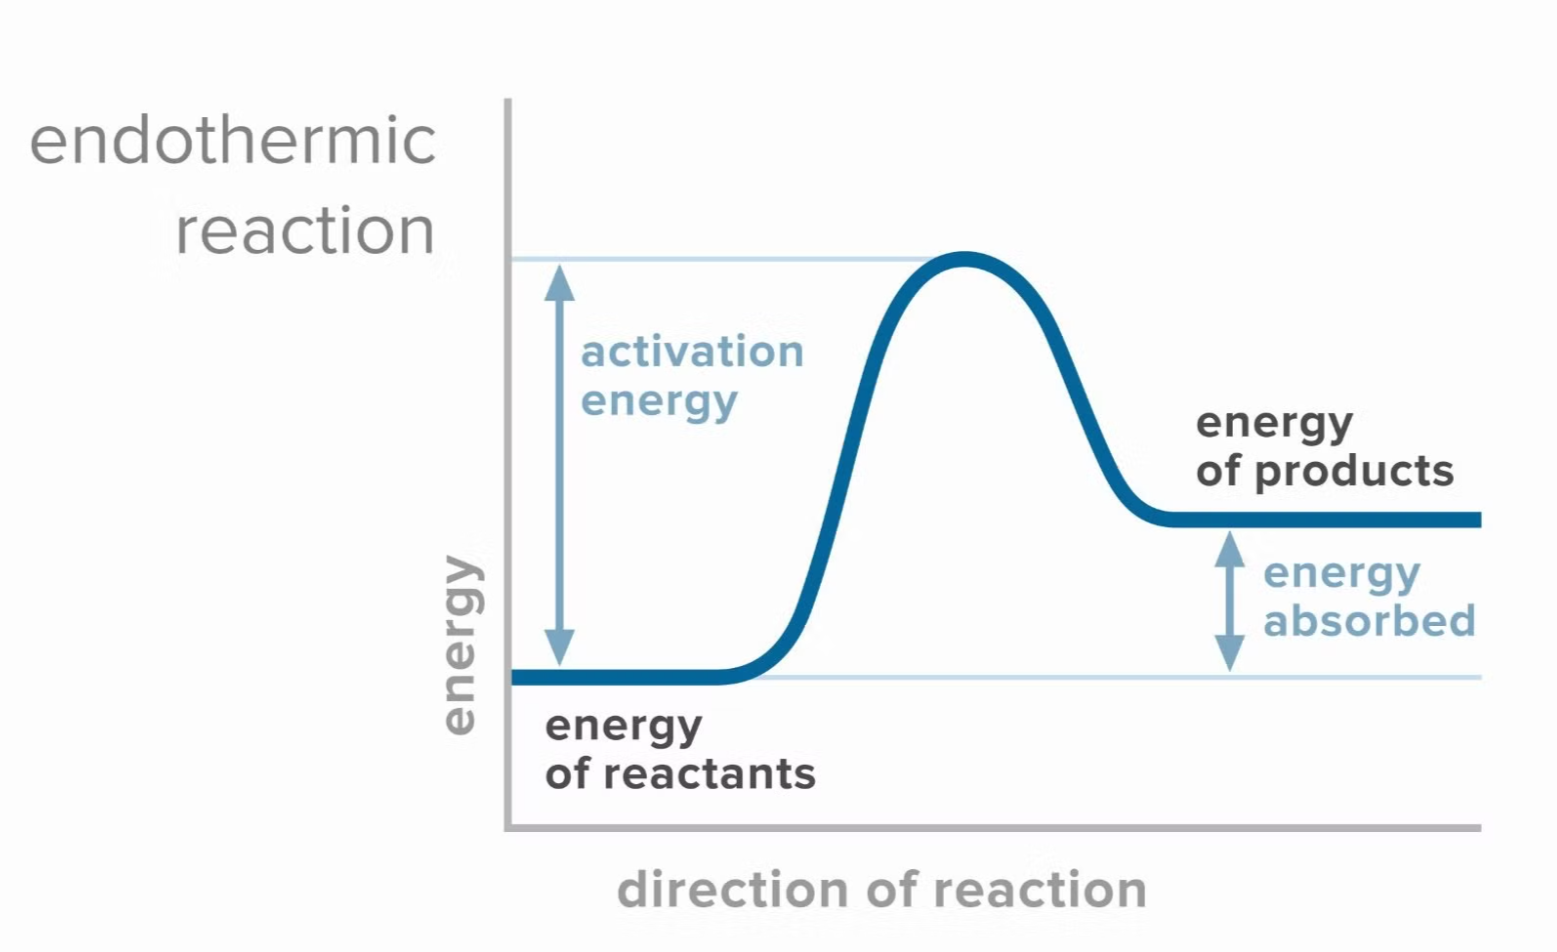
- Initial state: Reactants begin at a lower energy level.
- Transition state: A peak still represents the activation energy.
- Final state: Products are at a higher energy level, demonstrating that energy was absorbed during the reaction.
Activation Energy in Energy Level Diagrams
- Ea (Activation Energy) is critical for understanding how a reaction starts.
- For both exothermic and endothermic reactions, a certain amount of energy (Ea) must be provided to break the bonds of the reactants and initiate the process.
- The peak between the reactants and products on the energy diagram represents the activation energy barrier.
Catalysts and Energy Level Diagrams
A catalyst provides an alternative pathway for the reaction with a lower activation energy. In an energy level diagram:
- The peak for the activation energy is lowered, indicating that less energy is needed to start the reaction.
- The catalyst does not alter the reactants, products, or the overall of the reaction. It only affects the activation energy (Ea).
Example Energy Level Diagram Interpretation
For a combustion reaction (which is exothermic):
-
The reactants (fuel and oxygen) are at a higher energy level than the products (carbon dioxide and water).
-
The energy level diagram shows a significant drop in energy as the products are formed, with a large negative representing the energy released. For a photosynthesis reaction (which is endothermic):
-
The reactants (carbon dioxide and water) are at a lower energy level than the products (glucose and oxygen).
-
The diagram would show a rise in energy, as energy is absorbed, resulting in a positive .
Summary
- Energy level diagrams show the energy changes during a reaction, illustrating whether the reaction is exothermic or endothermic.
- The difference in energy levels between reactants and products corresponds to the enthalpy change ().
- Activation energy (Ea) is represented by the peak, showing the energy required to start the reaction.
- Catalysts lower the activation energy but do not change the overall . By understanding these diagrams, you can predict whether energy is absorbed or released and how catalysts affect the reaction rate.