Big Data (AQA A-Level Computer Science): Revision Notes
Big Data
Introduction to big data
Big data refers to datasets that are extremely large or complex, making them challenging to store, handle and analyse effectively. The difficulty arises from several factors: the sheer size of the data may require multiple servers for physical storage, standard database software might not be able to handle the volume of information, and the data may be changing so rapidly that structuring it becomes problematic. Additionally, when data is being updated in real-time, analysing it becomes even more complicated.
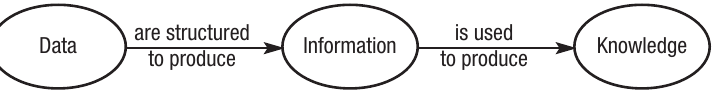
Understanding how data transforms into useful knowledge is essential when working with big data. Data collected for a specific purpose needs to be structured to turn it into meaningful information, which can then be used to produce knowledge. However, if the quantity of data cannot be properly structured and analysed, it becomes impossible to extract useful results.
This presents the fundamental challenge of big data—if it can't be converted into valuable information, there's little benefit in collecting it initially. The ability to transform raw data into actionable knowledge is what makes big data truly valuable.
Characteristics of big data
Big data is challenging to define precisely because there is no universally accepted quantifiable definition. However, three main characteristics help identify big data, often referred to as the "three Vs":
Volume
Volume refers to the sheer amount of data being handled, which exists on a very large scale. This could mean terabytes, petabytes or even larger quantities of information that far exceed what traditional database systems can manage efficiently.
Variety
Variety describes the wide-ranging and diverse types of data being collected. Big data can include structured database entries, unstructured text documents, multimedia files, sensor readings, social media posts and many other formats. This diversity makes the data difficult to classify and process using standard methods.
Velocity
Velocity refers to the speed at which data changes and the rate at which it arrives. Big data often includes constantly changing data sources where information is being updated continuously, sometimes in real-time. This rapid change means that by the time you finish analysing one batch of data, new data has already arrived that might alter your conclusions.
Examples of big data applications
Big data is created continuously across many different areas of modern life. While some applications simply record factual data like banking transactions, big data is increasingly being used to analyse trends and make predictions based on relationships and correlations within the data.
Scientific research
Scientists generate enormous volumes of data through their research activities. This data can be measured in petabytes or exabytes and comes from sources such as weather sensors, telescopic observations, biological experiments and global health statistics. The data is collected and analysed for scientific purposes, typically to improve people's quality of life.
For instance, the human genome project uses massive amounts of data to identify the causes of genetic illnesses with the goal of finding cures. This project demonstrates how big data can be applied to solve real-world health challenges.
Retail sector
Large businesses, particularly online retailers, make extensive use of data. A single online retailer might have millions of customers generating billions of sales transactions. This data is analysed to improve business performance by spotting trends in consumer behaviour, which enables businesses to become more profitable through better understanding of their customers' needs and preferences.
Banking and finance
The banking sector handles billions of transactions annually. Banks must keep this data secure and maintain an audit trail of every single transaction to prevent financial loss and fraud. The volume and sensitivity of this data makes it a prime example of big data challenges.
Government services
Most government departments and agencies maintain massive datasets. For example, the NHS records every single patient interaction, appointment and operation. This data is critical for successful patient treatment and can literally be a matter of life and death. The scale and importance of government data makes it essential to manage effectively.
Mobile networks
An estimated 4.6 billion mobile phone contracts existed worldwide at the time of writing. All customer and call data must be recorded to enable accurate billing. This represents billions of data items being generated every day.
Security and surveillance
Legislation permits mobile phone calls, text messages, email messages and other online communications to be recorded. This creates billions of data items daily that can be analysed by security services to identify potential terrorist threats.
Real-time applications
Many applications, particularly online and mobile ones, make use of real-time data. Weather apps collect data readings from sensors continuously, whilst city traders use software that enables trading based on second-by-second share price fluctuations. This real-time nature adds another layer of complexity to big data management.
Internet usage
A significant amount of big data is created through everyday Internet use. Data from social media websites can be analysed to understand social attitudes and trends, whilst search query data helps us understand how people use the web. This continuous stream of user-generated data provides valuable insights into human behaviour.
Understanding latency
As the examples above demonstrate, one major challenge of working with big data is that datasets are constantly changing as new data arrives. For instance, weather data may be collected from remote sensors every few seconds. To be useful, this data needs to be stored, processed and transmitted within a few seconds or minutes.
The concept of latency is crucial here, just as it is in other areas of computing. In the context of big data, latency describes the time delay between a user making a request for data and that data being received, or the amount of time required to transform raw data into meaningful information.
With big data, there may be a large degree of latency due to the time needed to access and manipulate the enormous number of records. For some applications, a large amount of latency may be acceptable, but for others, the data must be processed within seconds to remain useful.
Case study: H1N1 and Google Flu Trends
When a flu pandemic occurs, health services around the world must respond quickly by introducing vaccination programmes and ensuring adequate vaccine supplies reach the neediest areas. A major challenge lies in targeting resources to the locations where outbreaks will cause the greatest harm. Various health organisations, such as the NHS in the UK and the Centers for Disease Control (CDC) in the USA, use big data to understand what is happening in the immediate term and to predict future developments.
Historical data can reveal how viruses might spread, whilst more up-to-date data helps track current situations. The data used is not real-time since there is a delay in receiving and capturing it.
To address this issue, Google established their own big data project called Google Flu Trends (GFT), which analysed real-time search data. The theory suggests a correlation between people searching for flu-related information and the actual incidence of flu symptoms. By matching the geographical location of searches, it would be possible to predict areas where flu is prevalent or spreading on a daily basis, providing much faster insights than traditional data collection methods.
Structured and unstructured data
Big data presents major challenges not only in terms of volume and frequency of change but also regarding the nature of the data being collected. Most databases operate on the model that data will fit into columns and rows, otherwise referred to as fields and records. This structure makes data easy to organise and store since information can be entered into appropriate fields. When data needs to be analysed, it becomes relatively straightforward to carry out searches and sorts to query the data.
However, some data does not fit neatly into this model. Data can be defined as either structured or unstructured:
Structured data
Structured data refers to data that can be defined using traditional database techniques with fields and records. This means it is possible to assign each data item a field name and type. For example, customer data would fall into this category as it is possible to identify fields for name and address. Banking data would be structured as you could define fields such as sort code and bank account number.
Unstructured data
Unstructured data refers to data that cannot be defined in columns and rows. This might include multimedia data, web pages and the contents of emails, documents and presentations.
It is important to note that although each of these types of data has its own internal structure, they do not fit easily into the standard database structure, making it difficult to analyse their contents directly. This is one of the key challenges in working with big data.
Machine learning techniques
When quantitative data is stored in standard relational database format, it becomes relatively simple to query the data to produce results. For example, if an online retailer wanted to know how many of a particular product they sold this week, they could perform a simple query to find this information. Even on a large dataset, this could be produced relatively quickly and accurately.
However, qualitative data is much harder to analyse, and it is this type of data that is most likely to be unstructured. For instance, if an online retailer asks for feedback from their website in the form of customer comments, they could receive millions of data items, all written in free text. Reading all of these manually would take an impossibly long time, so techniques collectively known as machine learning can be used to automate the process.
Machine learning encompasses everything from pattern recognition to artificial intelligence systems. In the context of big data, at a simple level, the machine could be programmed to look for patterns of words within text to determine the nature of feedback. For example, it could search for positive or negative words to classify feedback as positive or negative. To achieve this, the system would need to be programmed with the specific words or phrases to identify.
Advanced machine learning
A more sophisticated form of machine learning occurs when the computer is able to develop its own knowledge based on the data it is manipulating. This is particularly valuable with big data as there may be patterns and correlations that exist within the data that are not immediately obvious.
One technique, called predictive analytics, is widely used in the financial and insurance sectors to predict risk by identifying hidden patterns in large datasets. This approach allows organisations to make informed decisions based on data-driven predictions rather than intuition alone.
Case study: CAIS
CAIS (pronounced "keys") is the Credit Account Information Sharing database that stores over 400 million records of credit transactions, covering everything from bank loans to credit cards and overdrafts. This information is used by banks and other lenders to determine whether a customer has a good or bad credit history and to identify the level of risk associated with that customer. Different lenders can use the data to determine a credit score, which in turn helps them to set credit limits and interest rates.
This system exemplifies big data, where the data needs to be very accurate and provided quickly, normally within a few seconds or minutes during the loan application process. The massive scale and time-sensitive nature make it a perfect example of big data challenges.
Issues with big data
Working with big data presents numerous challenges that organisations must address:
Key Challenges of Big Data:
-
Storage and analysis difficulties: Datasets are so large that they become too difficult to store and analyse using conventional methods.
-
Unstructured data complexity: Unstructured data can be very difficult to analyse in an automated way, requiring sophisticated techniques to extract meaningful information.
-
Need for specialised software: Managing and extracting meaningful information from big data requires specialised software tools that go beyond standard database management systems.
-
Processing power requirements: Massive storage and processing power is needed, meaning that many big data applications can only be carried out on supercomputers or large dedicated networks.
-
Constantly changing data: Data is constantly changing, making it difficult to keep track of every modification and ensuring that analyses remain current.
-
Correlation versus causation: Finding a correlation in a dataset does not necessarily mean you have found the answer to a problem. In other words, it is possible to infer incorrect conclusions from the data. Just because two things appear related statistically doesn't mean one causes the other.
-
Concurrency issues: There is an issue with concurrency when several users are working on the data at the same time. This can lead to data locking and conflicts between different users' actions.
Modelling big data
Most big datasets are stored in what are called data warehouses, which, as the name suggests, are very large storage systems. In common with a normal warehouse, there needs to be some system for understanding what is stored within the facility. One method used is called modelling, which attempts to identify fundamental facts within the data that in turn identify all of the entities within the data. These are represented as diagrams or expressed in natural language.
Graph schema approach
For example, a large online retailer may have millions of items of data. They will record uniquely identified time-stamped facts such as "We sold 1 million rechargeable batteries" or "We sold 2 million clock radios." Facts such as these can be defined in a more abstract form such as "We sold QUANTITY PRODUCTS." In this format, it is possible to model other data that the retailer records.
To represent this in graphical form, a graph schema can be created based on the graph data type. Graphs are made up of nodes, properties and edges. A graph schema for a dataset representing an online retailer might include:
- A node is an entity such as a customer, product or picker (warehouse worker)
- A property is relevant data relating to the node, such as the customer ID or product name
- An edge shows the link and describes the relationship between two nodes, for example showing which customer bought which product, or which picker has been assigned to collect and post the items
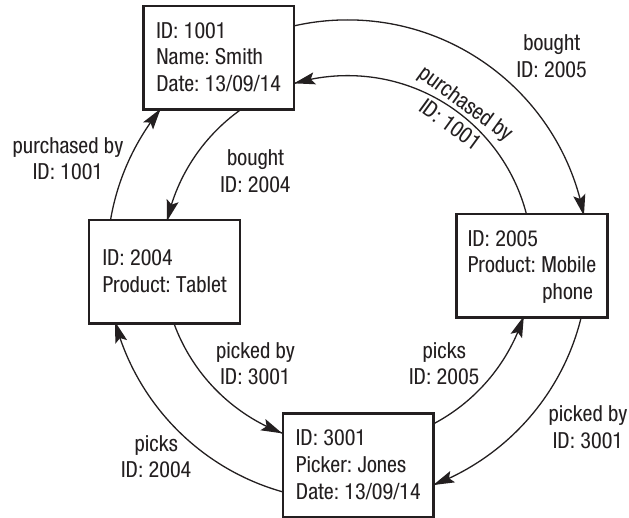
These models are considered to be more efficient for dealing with large amounts of constantly changing data. In the example above, the online retailer might want to link two orders made by the same customer at the same time to the same picker in the distribution centre. This type of flexible relationship is easier to represent using graph schemas than traditional relational database models.
Distributed processing
The main issue with big data is that one computer cannot store all of the data or analyse it quickly enough. One solution is to split the work over several computers, typically by adding more servers or workstations to a network and then distributing the processing between the processors of each machine.
This is known as distributed processing or distributed computing. For big data, often a dedicated network is set up to work on the same main task. Typically, one computer will be allocated as the master computer within the network and will control the others through the operating system and specialist software. Each computer on the network is allocated its own subtask, and messages are then passed between the computers in order to meet the overall goal. The network can be implemented on a client-server or peer-to-peer basis.
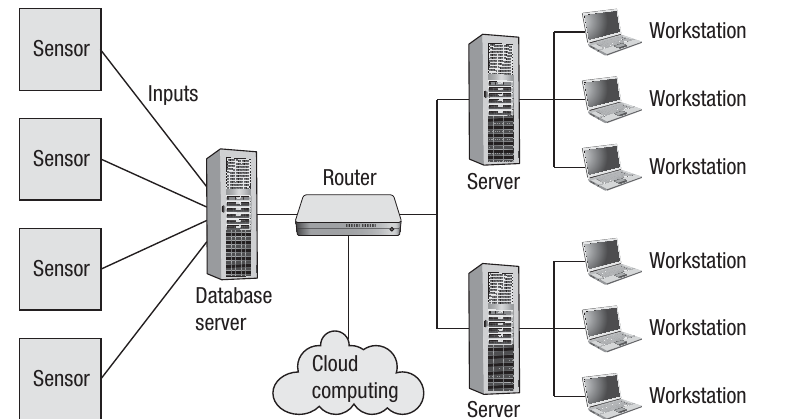
This approach can be implemented as a distributed network with each of the main computers being a server, with further workstations attached to each server. Similarly, the network can be extended to include Internet services, such as the use of online data storage. This is an example of cloud computing, where the Internet is used to provide a service that you would normally get from a local area network (LAN).
Big data almost inevitably requires distributed computing of some sort, as the data entry source is usually remote from the computer where the data is stored and analysed. For example, customer data will come from the Internet, whilst meteorological data will come from remote sensors located in various geographical locations.
Distributed programs
When specialist software is used to tackle a task using distributed computing, it is referred to as a distributed program. There are implications for programmers writing distributed programs in terms of dealing with multiple users and ensuring the integrity of large datasets. One resolution to this challenge is to use functional programming techniques.
Functional programming for distributed programs
In earlier chapters, we looked at programming paradigms, which describe the way in which any particular programming language works. For example, Visual Basic is described as an imperative or procedural language, as the programmer has to define the list of steps required to implement the program. Key features of imperative languages include the need to declare variables and to identify the correct sequence of events to achieve the desired outcome.
Functional programs differ in that they use expressions similar to normal mathematical expressions to evaluate data. There are no variables as such—every item of data is treated as a function. A feature of variables in imperative languages is that they are mutable, which means they will change as the program runs. This means variables will have a state, which is the current value of the variable at any given point when the program is being run.
This is said to have side effects, which means that the programmer has changed the state of a variable and this may impact on how the program runs. This is a normal consequence of imperative or object-oriented languages. When the side effect is known, it becomes possible to write future lines of code with knowledge of what has occurred previously.
Why functional programming suits distributed computing
This presents a problem when many computers might be working on the same data at the same time—each computer will need to know the state of the variable at any point. With functions, the values and the expressions are all that is needed to make up the lines of programming code. This means that the value produced by any one line of code is entirely the result of the function and is not dependent on the state of any of the variables.
This makes functional programming particularly suited to analysing big data using distributed processing, as there will be multiple users all accessing the data at the same time from different computers. This is known as concurrence, and it is problematic because it can cause data locking as we saw in previous chapters. When there are several users, the side effects of any previous coding may not be apparent.
Because functional programming does not use variables as such, and as the value of the variable is not changing, there will be few or no side effects. This means that the user always gets the original value of the variable to put into their own functions, and the output of the function will be local to their machine. This eliminates many of the concurrency problems that arise when multiple users work on the same data simultaneously.
Remember!
Key Points to Remember:
-
Big data refers to extremely large or complex datasets that are too difficult to store, manipulate and analyse using traditional database techniques.
-
The three main characteristics of big data are volume, variety and velocity – the sheer amount of data, the diverse types of data collected, and the speed at which data changes.
-
Structured data fits into standard database formats with defined fields and records, whilst unstructured data (such as multimedia files, documents and web pages) does not fit this model and requires different analysis techniques.
-
Machine learning techniques automate the analysis of big data, particularly unstructured data, by identifying patterns and relationships that would be impossible for humans to process manually.
-
Distributed processing splits big data tasks across multiple computers in a network, allowing the work to be completed faster and handling data volumes that a single computer couldn't manage alone.
-
Functional programming is particularly well-suited for distributed big data processing because it avoids side effects and concurrency issues by treating all data as functions rather than mutable variables.