Fieldwork Example: Changing Places (AQA A-Level Geography): Revision Notes
Fieldwork Example: Changing Places
Introduction to the fieldwork
This fieldwork investigation demonstrates how geographical skills can be applied to study changing places, focusing on a real-world planning scenario. The example centres on a proposed housing development that highlights the tensions and challenges communities face when places undergo transformation. This type of study allows you to investigate how places change over time and the different perspectives people hold about those changes.
Fieldwork investigations work best when they combine theoretical geographical concepts with real-world situations that affect actual communities. The Changing Places topic naturally provides opportunities for both qualitative and quantitative data collection.
Study location and context
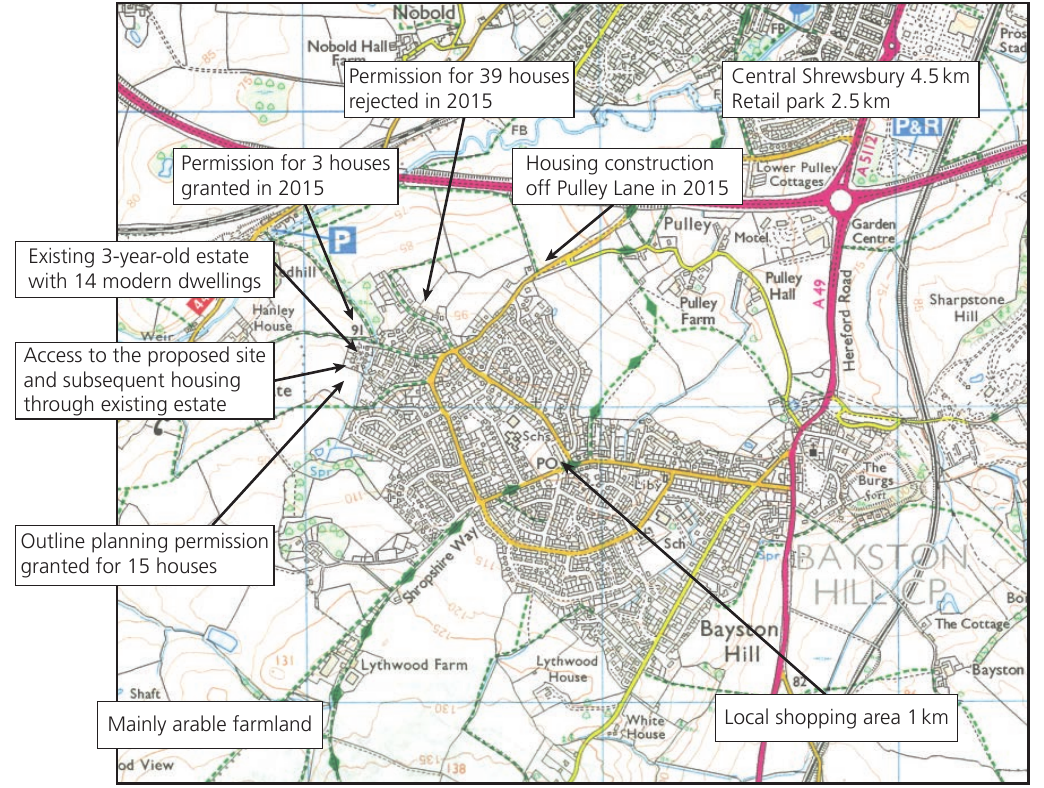
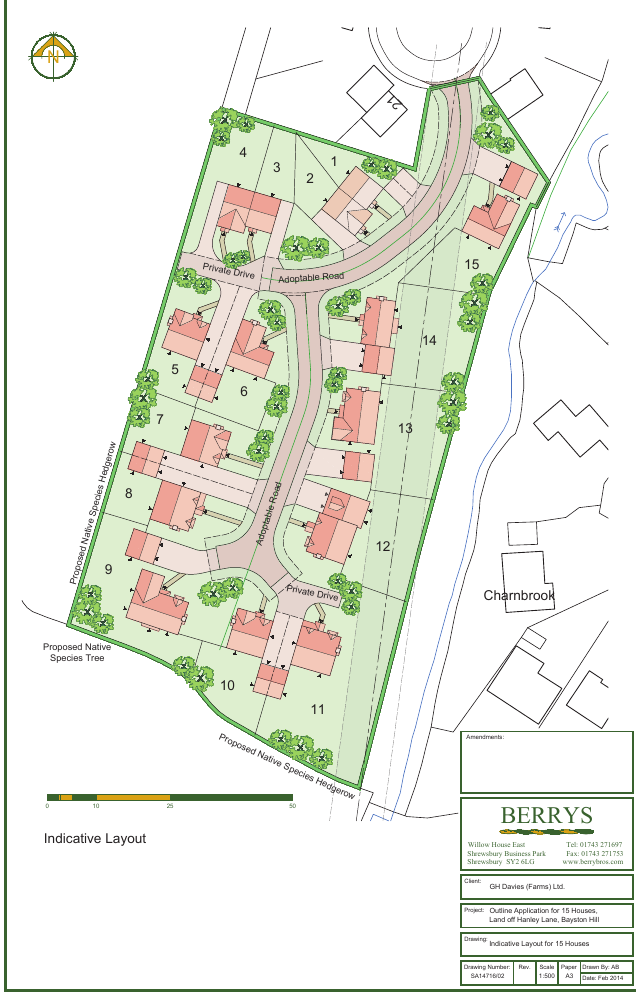
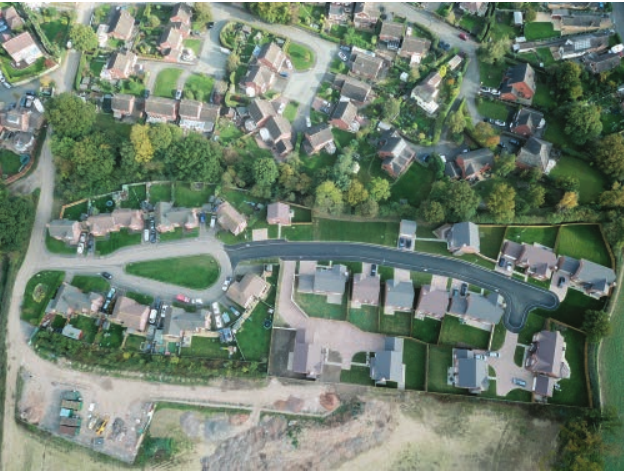
The fieldwork is based in Bayston Hill, a large village located on the rural/urban fringe near Shrewsbury in Shropshire. This location is geographically significant because it sits at the boundary between established urban development and surrounding agricultural land. The site specifically examines a proposed development of 15 houses planned for arable farmland on the western edge of Bayston Hill.
The village's position makes it an excellent case study for investigating changing places. Bayston Hill is already the largest village in Shropshire, surpassing even the county's market towns in size. The settlement's proximity to central Shrewsbury (4.5km away) means it experiences pressure for residential expansion, whilst also maintaining connections to its rural character through surrounding farmland.
Why the rural/urban fringe matters for fieldwork:
The rural/urban fringe is the transitional zone where urban areas meet countryside. This boundary zone is particularly valuable for geographical investigation because:
- It experiences the strongest development pressures
- Multiple stakeholders have competing interests in land use
- Changes are often visible and ongoing, making them easier to study
- You can directly observe the tension between urbanisation and rural preservation
The map shows the complexity of development in this area, with various planning permissions granted and rejected, existing housing estates, and the proposed new site accessible through the existing settlement. The surrounding area includes retail facilities (2.5km away) and local shopping areas (1km away), demonstrating how this rural/urban fringe location provides access to urban amenities whilst maintaining a village setting.
The research issue and question
In early 2012, plans emerged to change Bayston Hill's official status from a village to a town. However, these plans were subsequently abandoned following concerns raised by local residents. Many people living in the village expressed worry that official town status would accelerate growth and fundamentally alter the settlement's character, causing it to lose its distinctive 'rural feel'. This reaction reveals how strongly residents identified with the village's existing character and how they perceived rapid change as a threat to their sense of place.
However, this perspective exists in tension with another geographical reality. Shrewsbury has been experiencing what planners describe as an 'overwhelming housing shortage'. This creates genuine pressure for new housing development, as the town struggles to accommodate population growth and meet housing demand. The challenge becomes particularly acute in places like Bayston Hill, which offers accessible land on the urban fringe.
The central research question
How can these two competing needs be reconciled? Specifically, how can housing development proceed to address shortages whilst preserving the character and identity that makes places like Bayston Hill valued by their communities?
This question makes the location ideal for fieldwork because it involves multiple stakeholders with different perspectives, includes both quantitative and qualitative data opportunities, and addresses a contemporary geographical issue relevant to many UK settlements.
Data collection methods
A robust fieldwork investigation combines both secondary and primary data sources. This mixed-method approach allows you to establish context through existing records whilst also gathering fresh, location-specific information through your own fieldwork.
Secondary data sources
Secondary data provides essential background information and establishes patterns over time. For this investigation, several sources would be valuable:
Census data: Recent census records for Bayston Hill reveal how the population has grown over time. By examining multiple census years, you can identify trends in population size, age structure, household composition, and other demographic characteristics. This quantitative data helps establish the extent and pace of change in the settlement.
Planning portal information: Local authority planning portals contain detailed records of housing development applications. These official documents show where developments have been proposed, which applications were approved or rejected, and the reasons behind planning decisions. For this study, you can access records showing that permission for 39 houses was rejected in 2015, permission for 3 houses was granted in 2015, and outline planning permission was approved for the 15-house development under investigation.
Accessing planning portal data:
Most local councils provide online planning portals where you can search for applications by address, reference number, or map location. These portals typically include:
- Application documents and supporting statements
- Planning officer reports with recommendations
- Public consultation responses
- Decision notices with reasons for approval or rejection
This secondary data is freely available and provides valuable context before conducting primary fieldwork.
Ordnance Survey maps and GIS: Map collections, including digital GIS (Geographic Information Systems) data, allow you to analyse the spatial pattern of development. You can compare historical and current Ordnance Survey maps to visualise how the settlement has expanded over time, measure distances to amenities, and understand the relationship between the proposed site and existing development.
Primary data collection techniques
Primary data that you collect yourself provides current, specific information directly relevant to your research question:
Stakeholder surveys and interviews: Conducting structured interviews or surveys with interested parties offers insights into different perspectives on the development. Key stakeholders include:
- The landowner who owns the arable farmland
- The developer proposing the houses
- The planning officer assessing the application
- Local councillors representing the community
- Residents of the nearby existing estate
Each group brings different priorities and concerns to the issue.
Resident questionnaires: A broader questionnaire distributed to village inhabitants can reveal community attitudes towards the proposed changes. Rather than surveying everyone, you could use an age-related stratified sample. This sampling technique divides the population into age groups (strata) and selects a proportional number from each group, ensuring that younger and older residents are fairly represented. This approach is particularly important because different age groups may have varying perspectives on housing development and village growth.
Understanding stratified sampling
A stratified sample is more representative than a simple random sample because it ensures all subgroups in your population are proportionally represented.
For example, if census data shows Bayston Hill's population is 30% under 25, 45% aged 25-60, and 25% over 60, your sample should reflect these proportions. If you plan to survey 100 residents, you would aim for approximately 30 young people, 45 middle-aged residents, and 25 older residents.
This prevents bias that might occur if you only surveyed people you happened to encounter, who might predominantly be from one age group.
Traffic surveys: Concerns about access to the proposed site and the impact on local roads make traffic surveys relevant. These could be carried out at different times to examine current traffic patterns and assess how developers and future occupiers would access the houses. Traffic counts provide quantitative data that can be compared before and after development.
Data presentation and analysis
Once collected, your data needs to be processed and analysed systematically. The specific analytical approach depends on what you discover during data collection.
Interview analysis: Responses from stakeholder interviews can be coded according to themes that emerge. For example, you might identify themes such as 'concern about infrastructure', 'economic benefits', or 'loss of rural character'. Coding allows you to quantify how frequently different perspectives appear and compare viewpoints between stakeholder groups.
Worked Example: Coding Interview Data
Suppose you interviewed 5 stakeholders and received these responses about the development:
Developer: "This will provide much-needed housing and boost the local economy" Resident A: "I'm worried about increased traffic and pressure on local schools" Councillor: "We need housing, but we must preserve the village character" Resident B: "Property values might decrease, and it will feel more crowded" Planning Officer: "The site is suitable, though traffic management will be important"
You could code these responses into themes:
- Economic impact (mentioned by 1 person - positive)
- Housing need (mentioned by 2 people - positive)
- Traffic concerns (mentioned by 2 people - negative)
- Infrastructure pressure (mentioned by 1 person - negative)
- Character/identity (mentioned by 2 people - negative)
This reveals that concerns about character and traffic are most frequently mentioned, whilst economic benefits receive less attention.
Questionnaire data: Responses from resident questionnaires can be easily organised into tables showing the frequency of different attitudes or opinions. This quantitative data can then be presented using appropriate graphs, such as bar charts comparing opinions across age groups, or pie charts showing the proportion of residents supporting or opposing development.
Traffic survey results: Traffic count data collected at different times can be presented in line graphs showing temporal patterns, or comparative bar charts illustrating access route usage. This helps assess whether access concerns are justified by current evidence.
When presenting quantitative data, always:
- Choose graph types that clearly show the patterns you've identified
- Include clear titles, axis labels, and units
- Add keys or legends where necessary
- Write analytical captions that interpret the data rather than just describing it
The analysis should always link back to your research question, examining how the evidence helps you understand whether and how housing needs can be balanced with preserving place character.
Drawing conclusions
The conclusion of your fieldwork report depends entirely on what your investigation reveals. Rather than predetermined findings, your conclusion should emerge from the evidence you've gathered and analysed.
A balanced conclusion would acknowledge multiple perspectives. You might identify specific benefits that increased housing in this location would bring, such as addressing local housing shortages, providing homes for young families, or supporting the local economy. Simultaneously, you should recognise the legitimate concerns raised about the development, such as potential impacts on the village's character, pressure on local infrastructure and services, or loss of agricultural land.
Your conclusion should demonstrate geographical understanding by weighing these competing factors and perhaps suggesting how negative impacts might be mitigated. For instance, you might conclude that development could proceed if accompanied by specific measures to preserve character, such as design requirements, provision of additional infrastructure, or limits on future expansion.
Common mistakes to avoid in conclusions:
- Simply repeating your findings without synthesis or evaluation
- Taking a one-sided view that ignores competing perspectives
- Failing to link back to your original research question
- Not acknowledging limitations in your data or methodology
- Overgeneralising from a small sample to wider populations
A strong conclusion balances evidence, acknowledges complexity, and demonstrates critical thinking about the geographical issue.
Selecting fieldwork topics and questions
Choosing an appropriate fieldwork topic is crucial for your success, as fieldwork typically accounts for 20 per cent of your final A-Level course assessment. Beyond the marks, fieldwork also requires a substantial time commitment, so selecting a topic that genuinely interests you makes the investigation more engaging and manageable.
Several practical factors should influence your choice. Your geographical location matters - certain types of fieldwork may be difficult to conduct depending on where you live. For example, investigating glacial processes presents challenges if you live in south-east England. Consider what's accessible within a reasonable distance from your home or school.
Additionally, some aspects of the specification naturally lend themselves to fieldwork investigation more readily than others. Studies involving primary data collection, such as field measurements, surveys, or observations, often work better than topics requiring only secondary research. The Changing Places example works well because it combines accessible data sources with opportunities for varied primary data collection.
Adapting fieldwork to your location:
The fieldwork suggestions provided in specifications are guides rather than prescriptive requirements. You can adapt suggested locations and questions to suit your local area and specific circumstances.
For example:
- If the suggested topic involves coastal processes but you live inland, consider river processes instead
- If a case study focuses on a large city but you live rurally, adapt the question to investigate rural settlement patterns
- If international migration is difficult to study directly, consider internal migration patterns in your region
The key is ensuring your investigation addresses geographical concepts and allows you to demonstrate the required skills.
The fieldwork suggestions provided in specifications are guides rather than prescriptive requirements. You can adapt suggested locations and questions to suit your local area and specific circumstances. The key is ensuring your investigation addresses geographical concepts and allows you to demonstrate the required skills.
Remember!
Key Points to Remember:
- Fieldwork investigations should combine secondary data (census records, planning documents, maps) with primary data (surveys, interviews, observations) for a comprehensive study
- The rural/urban fringe provides excellent opportunities for studying changing places because it's where tensions between development pressure and character preservation are most visible
- Stratified sampling ensures representative data by dividing your population into groups and sampling proportionally from each group
- Always link your analysis back to your research question rather than simply describing what you found
- Choose fieldwork topics that are accessible to you geographically and that provide genuine opportunities for varied data collection methods