Quantitative Data (AQA A-Level Geography): Revision Notes
Quantitative data
Introduction to quantitative data
Quantitative data involves numerical information that can be measured and analysed statistically. In geography, you'll use various tools and techniques to collect this type of data, including GIS (Geographical Information Systems) and other spatial technologies. These help you gather, examine and present geographical information in measurable ways.
Working with quantitative data requires understanding descriptive statistics, particularly measures of central tendency (like means and medians), dispersion (how spread out data is), and correlation (relationships between variables). These statistical approaches are linked to scientific and experimental methods, providing reliable and analysable information.
Quantitative data refers to numerical information that can be measured, counted and analysed using statistical methods. It provides objective, measurable evidence that can be tested for reliability.
Sampling in geographical research
What is sampling?
In statistics, we call the complete group we're studying the statistical population. This represents every single item or person within the area of investigation. However, it's often impractical or impossible to collect data from every member of this population.
Sampling provides a practical solution. It's a method where you collect data from a carefully selected portion (a sample) of the whole population. The information gathered from this smaller group allows you to develop hypotheses and draw conclusions about the larger population.
Why use sampling?
Sampling becomes necessary when collecting data from everyone would be:
- Impossible due to the size of the population
- Too time-consuming
- Unnecessarily expensive
- Impractical given available resources
By selecting a representative portion of the population, you can gain insights into how the whole group behaves. For example, you cannot interview every shopper in a market town or every resident of a village, but by studying a carefully chosen fraction, you can gather evidence that indicates patterns across the entire population.
When conducting a sample survey, you must ensure your method collects data from a large enough and sufficiently representative group. For instance, if interviewing village inhabitants, your sample must include people from all age ranges to be truly representative.
Sampling considerations
Several important factors affect the validity and reliability of your sampling approach:
Understanding these considerations helps you design effective sampling strategies:
-
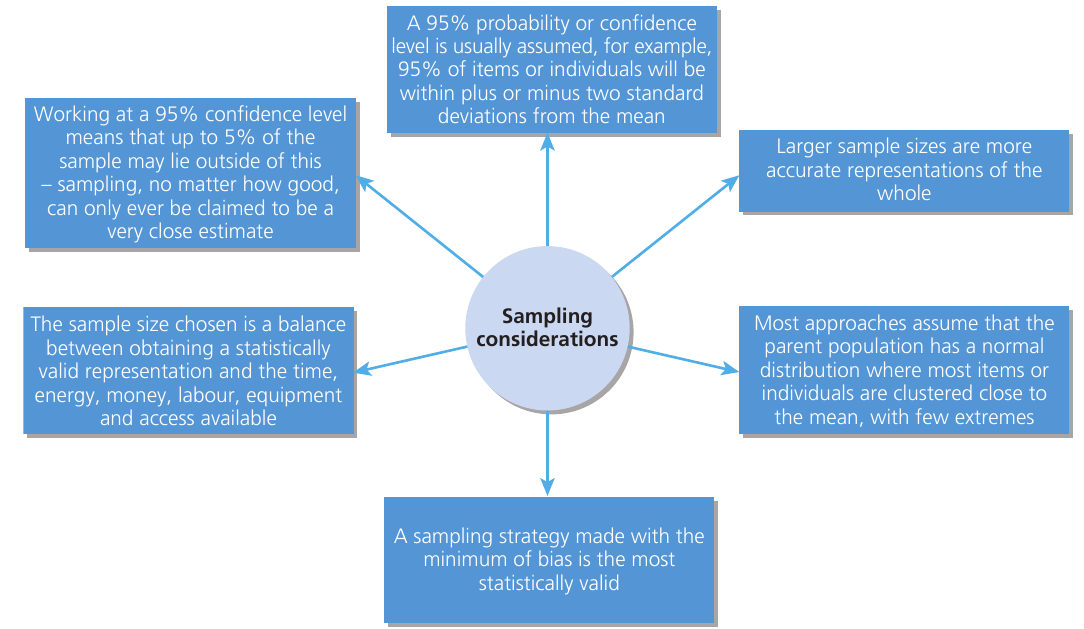
Confidence levels: Researchers typically work with a 95% confidence level, meaning 95% of items or individuals fall within plus or minus two standard deviations from the mean. However, working at this level means approximately 5% of your sample may fall outside this range, regardless of sampling quality. Results can only be described as very close estimates.
-
Sample size: Larger samples generally provide more accurate representations of the whole population. However, you must balance statistical validity with practical constraints like time, energy, money, available equipment and site access.
-
Normal distribution: Most sampling approaches assume the parent population follows a normal distribution pattern, where most items or individuals cluster close to the mean with few extremes.
-
Bias: A sampling strategy designed to minimise bias is the most statistically valid approach.
Types of sampling methods
There are three main sampling strategies, each with distinct characteristics:
Random sampling
Random sampling ensures every member of the population has an equal chance of being selected. This approach effectively avoids bias, making it particularly valuable for large populations.
Three methods of random sampling:
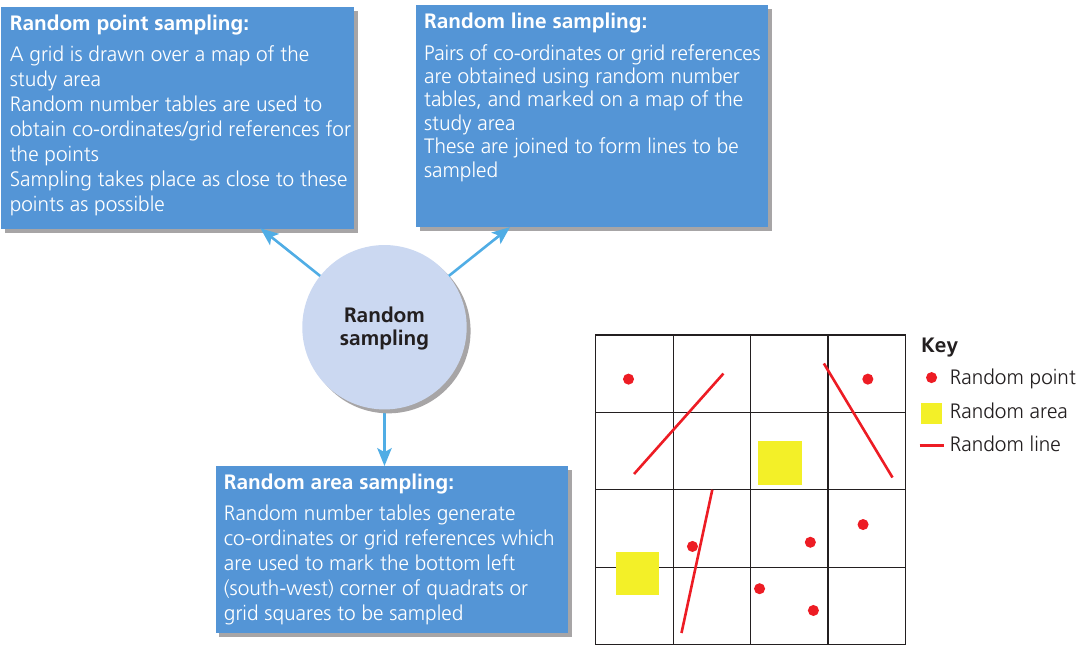
Random point sampling involves drawing a grid over a map of your study area. You use random number tables to generate coordinates, marking these points on your map. Sampling then occurs as close as possible to these randomly selected points.
Random line sampling uses random number tables to obtain pairs of coordinates or grid references, which you mark on your study area map. These coordinate pairs are then connected to form lines (transects) that you sample along.
Random area sampling employs random number tables to generate coordinates or grid references marking the bottom-left (south-west) corners of quadrats or grid squares. These marked areas become your sampling locations.
Advantages of random sampling:
- Works effectively with large populations
- Avoids bias in selection
- Every population member has equal selection probability
Disadvantages of random sampling:
- May poorly represent the overall population or area if large areas aren't covered by randomly generated numbers, particularly problematic in very large study areas
- Practical constraints regarding time and access to certain parts of the study area may limit effectiveness
Systematic sampling
Systematic sampling selects samples in a regular, organised pattern. This could involve:
- Evenly distributed points in a spatial context (for example, every 10 metres along a transect)
- Equal time intervals (for example, every hour or the same time daily)
- Regular numbering (for example, every tenth person or building)
Like random sampling, systematic sampling can be conducted using point, line or area approaches. You might use grid intersections for points, grid lines for transects, or regular grid squares for areas. For transect surveys, points are positioned at regular intervals along the line. Systematic line sampling could involve grid lines on a map or a series of transects at regular distances (such as every 20 metres along a beach). Systematic area sampling might use regularly spaced grid squares to create a consistent pattern.
Advantages of systematic sampling:
- More straightforward to implement than random sampling
- Doesn't require a grid necessarily; just needs uniform intervals
- Provides good coverage of the study area easily
Disadvantages of systematic sampling:
- More biased because not all members or points have equal selection chances
- Bias can lead to over or under-representation of particular patterns
Stratified sampling
This method requires advance knowledge about the population or area being studied. The parent population is divided into subsets of known size, which make up different proportions of the total population. Sampling should then be stratified to ensure results are proportional to each subset's size and representative of the whole.
Example: Age Distribution in Population Survey
When surveying a population to examine lived experience of a place and you know its age distribution, your sample must reflect that distribution:
- If the population is 30% aged 18-30, your sample should also be 30% from this age group
- If 45% are aged 31-60, your sample should reflect this proportion
- If 25% are aged 61+, your sample should match this percentage
Within each subset, you can still apply systematic or random selection methods to choose specific individuals.
Advantages of stratified sampling:
- Can combine with random or systematic sampling, and with point, line or area techniques
- Generates results more representative of the whole population when subset proportions are known
- Very flexible and applicable to many geographical enquiries
- Allows correlations and comparisons between subsets
Disadvantages of stratified sampling:
- Subset proportions must be known and accurate for proper functioning
- Can be challenging to stratify questionnaire data collection; identifying people's age or social background effectively may prove difficult
Sample size
The appropriate sample size depends upon the complexity of your survey. When using questionnaires, you must sample enough people to account for the considerable variety introduced by different questions. Practical difficulties and time constraints can restrict sample size, potentially affecting result reliability.
Your aim should be keeping the sampling error as small as possible. As a student researcher, you cannot be expected to conduct hundreds of interviews, but sampling only 20-30 people in an energy conservation survey wouldn't represent the population adequately. Finding the right balance is essential.
Ethical implications
You must be aware of ethical issues embedded in any study involving the collection, analysis and representation of geographical information about human communities.
The most common ethical dilemmas in human geography focus on:
- Participation
- Consent
- Safe-guarding and confidentiality of personal information
- Giving something back to the community
In physical geography, the main ethical considerations concern:
- Consent and access to study sites
- Potential damage or pollution of study sites
Always consider these ethical dimensions when planning and conducting your fieldwork.
Remember!
Key Points to Remember:
-
Quantitative data is numerical and can be analysed using statistical methods like measures of central tendency, dispersion and correlation
-
Sampling allows you to study a portion of a population to draw conclusions about the whole, which is more practical than studying everyone
-
Three main sampling types exist: random (equal chance for all), systematic (regular intervals), and stratified (based on known proportions of subsets)
-
Sample size matters - it must be large enough to be representative but balanced against practical constraints like time and resources
-
Always consider ethics when conducting research, including consent, confidentiality, and minimising harm to study sites or participants