Solving Equations Graphically (AQA A-Level Mathematics): Revision Notes
📚 Revision Notes
2.7.3 Solving Equations Graphically
Solving Equations Graphically
Solving equations graphically involves finding the points where two functions intersect on a graph. This method is particularly useful for visualising solutions to equations, especially when dealing with nonlinear functions such as quadratics, cubics, and reciprocals.
infoNote
Steps to Solve Equations Graphically
- Understand the Equation:
- Start with an equation that you want to solve, such as .
- The solution(s) to this equation correspond to the x-coordinates where the graphs of and intersect.
- Graph the Functions:
- Graph each function separately on the same coordinate plane.
- If the equation is , graph and find where it crosses the x-axis.
- For more complex equations, rearrange them if necessary to isolate the functions on either side.
- Identify the Intersection Points:
- The points where the two graphs intersect represent the solutions to the equation.
- The x-coordinates of these intersection points are the solutions.
- Estimate or Calculate the Solutions:
- If the graphs intersect at specific points, those x-values are the exact solutions.
- If the intersection occurs between grid points, you may need to estimate the solution or use technology (like a graphing calculator) for more accuracy.
infoNote
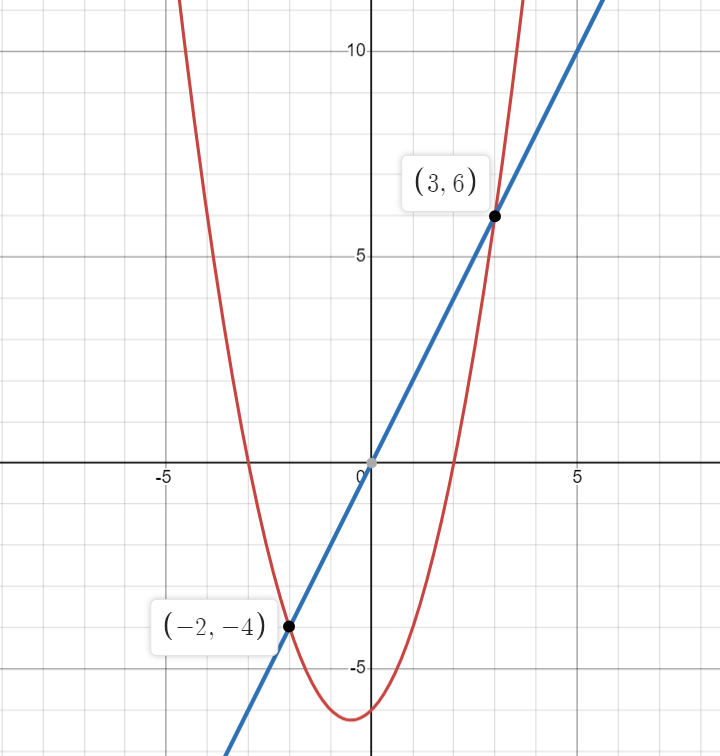
Example 1: Solving a Linear-Quadratic Equation Solve graphically.
Steps:
Rewrite the Equation:
-
Move all terms to one side:
-
This is equivalent to finding where the quadratic intersects the line Graph the Functions:
-
Graph (a parabola) and (a straight line) on the same axes. Find the Intersection Points:
-
Identify where the parabola and the line intersect. Suppose the graphs intersect at and Solution:
-
The solutions are x = -2 and x = 3.
infoNote
Example 2: Solving a Nonlinear Equation
Solve graphically.
Steps:
- Rewrite the Equation:
- Rearrange to , which simplifies to
- The equation can be solved by graphing .
- Graph the Function:
- Plot the cubic function on a graph.
- Alternatively, you could also graph and find their intersection with
- Identify the Intersection Points:
- Locate the point(s) where the graph crosses the x-axis. If it crosses at, and , these are the solutions.
- Solution:
- The solutions are x = -2, x = 1, and x = 2.
Summary:
- Graphing: Plot each side of the equation as a function on the same graph.
- Intersection Points: The solutions to the equation are where the graphs intersect.
- Estimation: Use the graph to estimate or precisely find the x-values of the intersections.