Modulus Functions - Sketching Graphs (AQA A-Level Mathematics): Revision Notes
2.8.4 Modulus Functions - Sketching Graphs
Modulus Functions and Inequalities
1. What is the Modulus Function?
The modulus function gives the absolute value of a number, which means it always returns the positive value, no matter the sign of the input:
-
If , then
-
If , then For example:
-
-
2. Solving Modulus Inequalities
To solve inequalities involving modulus functions, the key idea is to consider the two possible cases: the positive and negative values that might satisfy the inequality.
Example 1: Solving
The inequality means that the absolute value of is less than or equal to 3. This can be rewritten as:
So, the solution is all -values between -3 and 3, inclusive.
Example 2: Solving
The inequality means that the absolute value of is greater than 2. This can be rewritten as:
In this case, the solution is any -value outside the range between -2 and 2.
3. Modulus with Linear Expressions
You can also encounter inequalities with modulus functions involving linear expressions, like .
Example 3: Solving
To solve this inequality, follow these steps:
-
Rewrite the inequality without the modulus:
-
Solve for :
So, the solution is -3 ≤ x ≤ 5 .
Example 4: Solving
- First, split it into two cases:
- Solve each case separately:
-
For :
-
-
For :
-
So, the solution is x < -5 or x > 2 .
Key Steps for Solving Modulus Inequalities
- Understand the modulus: Write the modulus inequality as two separate inequalities.
- Solve the inequalities: Treat each part of the inequality as a regular linear inequality.
- Combine the solutions: Depending on the sign of the inequality (≤, ≥, <, >), you either combine or exclude parts of the number line.
Practice Problem
Solve the inequality: .
- Split into two inequalities:
- Solve each:
- Final solution: x ≤ -7 or x ≥ 3.
Understanding and practising these steps will help you handle modulus inequalities effectively.
Modulus Inequalities
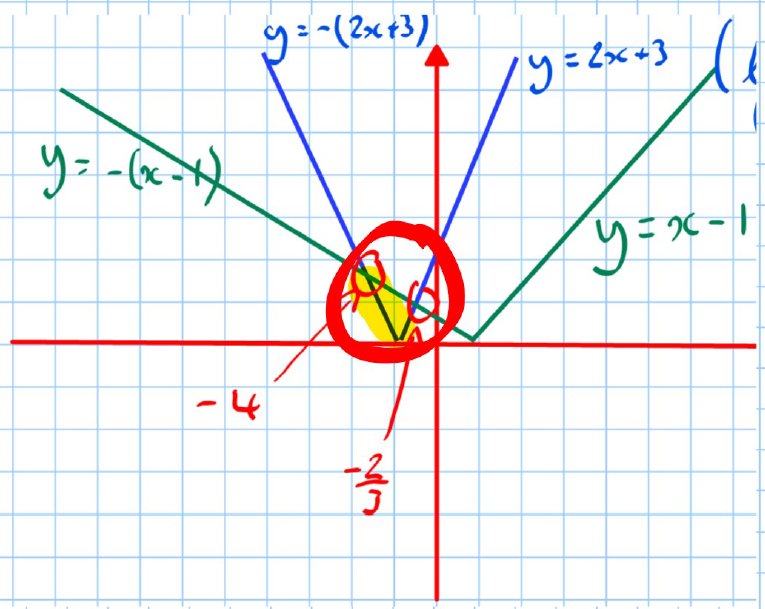
e.g. Solve (graphical method recommended)
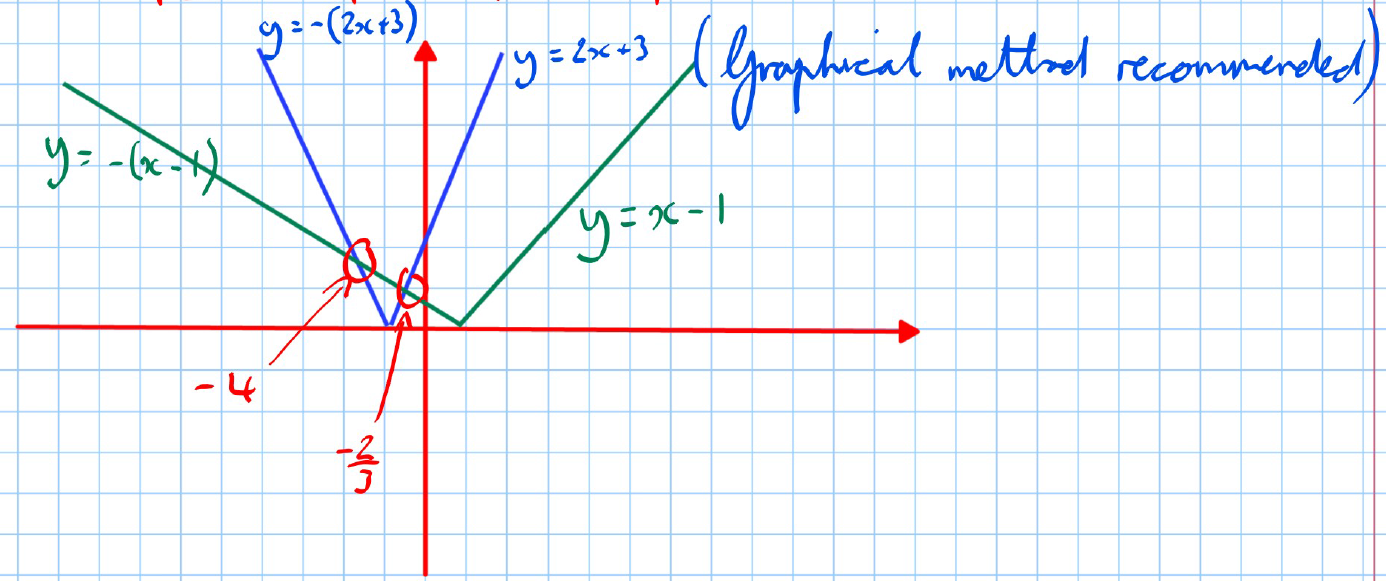
- Find the points of intersection using the graphical method:
- Decide from the graph which region(s) satisfy the inequality: We can see from that we require the regions where the graph of is under .
- Note: The squaring both sides method does work but you must check the answer.
Q1 (June 2007, Q2) Solve the inequality .
Graphical Representation:
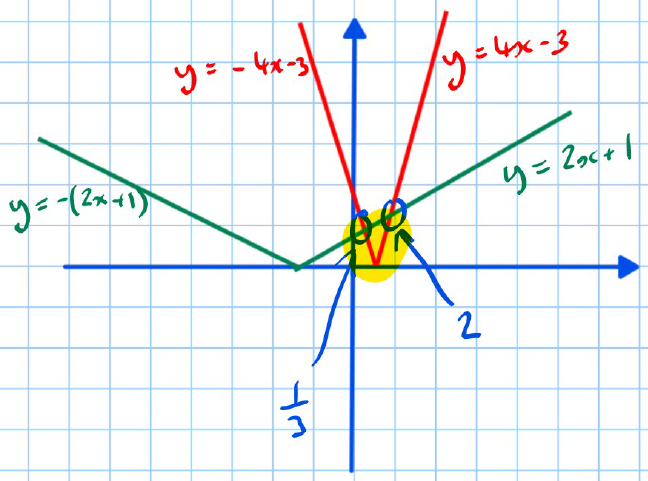
Steps to Solve: 7. Finding the Points of Intersection:
- Setting the two equations equal:
- Setting the negative of one side equal to the positive of the other:
- Solution:
- The points of intersection are and .
- The inequality is satisfied between these points. Hence, the solution is:
The Modulus Function
- The word modulus means "distance from origin". A distance is always positive, i.e., a scalar quantity.
Examples:
Graphs of Modulus Function
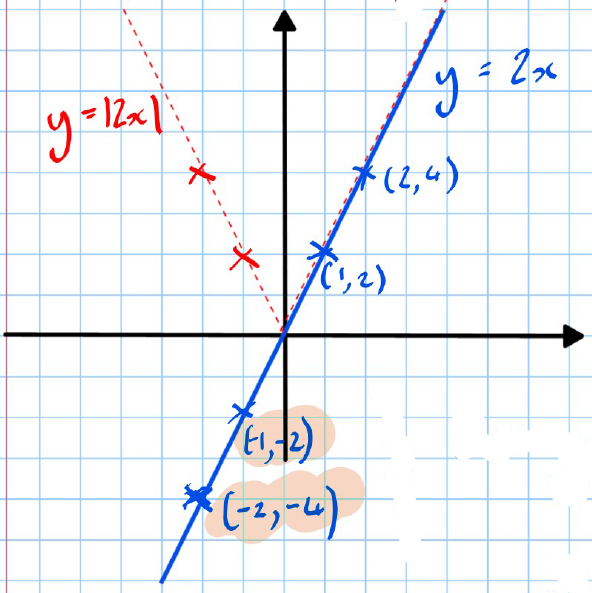
Example 1: Draw and on the same set of axes.
-
For :
-
If
-
For :
-
If In the graph:
-
The line is shown in blue.
-
The line is shown in red and reflects the negative part above the x-axis.
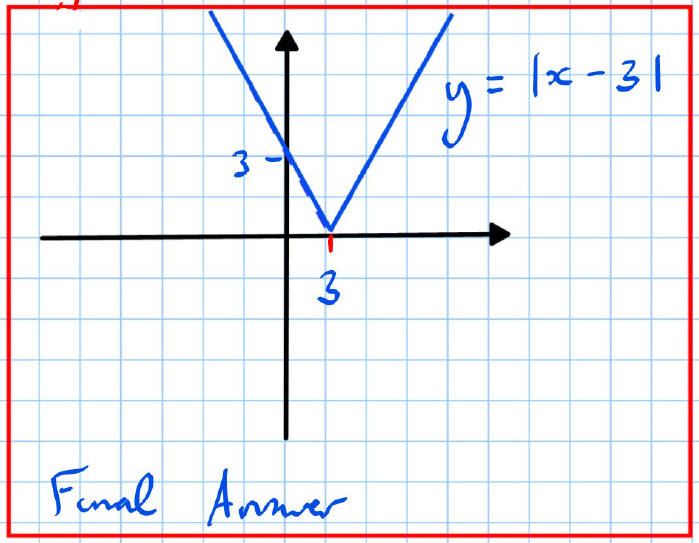
Example 2: Draw .
- Tip: Do a few drafts before presenting an answer.
-
Start with .
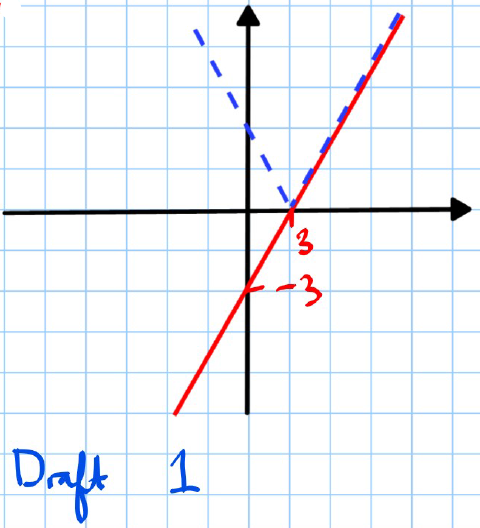
-
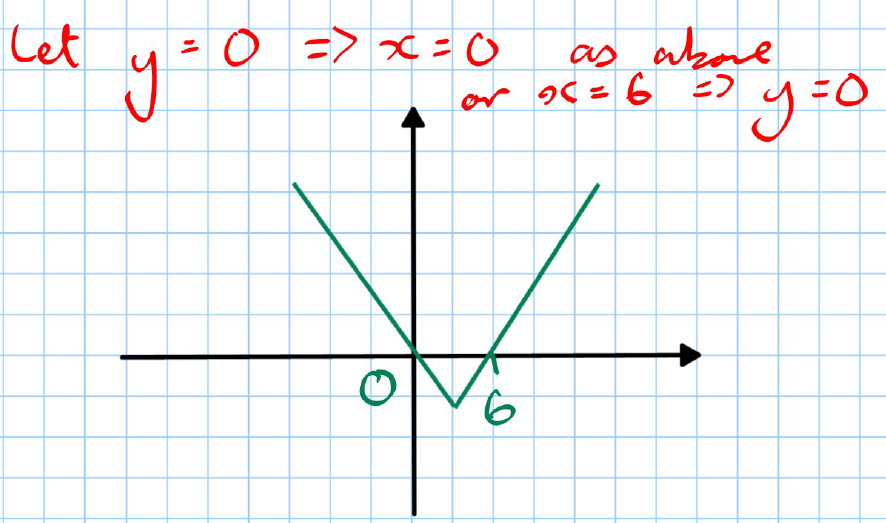
Find points where to identify where the modulus effect changes the graph:
- Set .
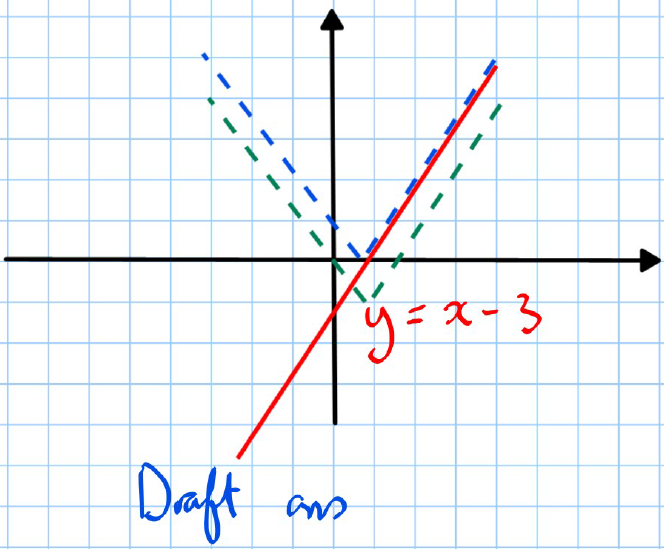
Drafts:
- Draught 1 shows the line and how it changes when .
- The final answer graph reflects the portion below the x-axis upwards, resulting in a V-shape at .
:::
The modulus function always reflects any negative values into positive values, creating graphs that are always at or above the x-axis.