Outliers & Cleaning Data (AQA A-Level Mathematics): Revision Notes
2.3.1 Outliers & Cleaning Data
Outliers are data points that are significantly different from the rest of the data. They can either be much higher or much lower than the other values in the data set. Outliers can affect statistical analyses by skewing results, so it's important to identify and handle them appropriately.
Identifying Outliers
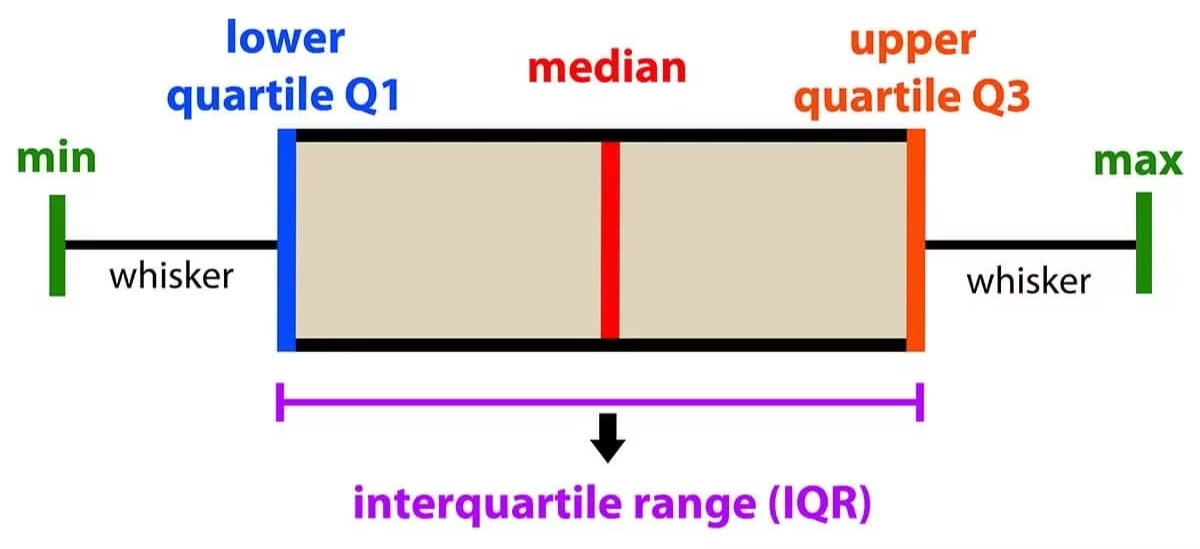
Box Plots:
One of the simplest ways to identify outliers is by using a box plot. In a box plot:
- Any data point outside of the whiskers ( times the interquartile range above or below ) is considered an outlier.
Z-Scores:
The Z-score measures how many standard deviations a data point is from the mean. Data points with a greater than or less than are often considered outliers.
Interquartile Range (IQR) Method:
- Calculate the IQR:
- Find the lower bound:
- Find the upper bound:
- Any data point outside this range is considered an outlier.
Example: Consider the data set:
- Q1 (Lower Quartile) =
- Q3 (Upper Quartile) =
- IQR =
- Lower Bound = (No outliers on the lower side)
- Upper Bound = Here, is an outlier because it is greater than .
Cleaning Data
Cleaning data involves addressing issues in the data, such as outliers, missing values, or errors, to ensure accurate analysis.
Steps for Cleaning Data:
- Identify and Handle Outliers
- Handle Missing Data
- Correct Errors
- Standardise and Normalise Data
- Identify and Handle Outliers:
- Remove Outliers: If an outlier is due to an error or doesn't belong to the dataset context, it may be removed.
- Transform Data: Sometimes, transforming the data (e.g., using logarithms) can reduce the impact of outliers.
- Use Robust Statistics: Instead of the mean, use the median, which is less sensitive to outliers.
- Handle Missing Data:
- Remove Missing Data: If the data set is large, you can remove rows or columns with missing values.
- Impute Missing Data: Replace missing data with a reasonable estimate, such as the mean, median, or mode of the remaining data.
- Use Algorithms: Advanced methods like k-nearest neighbours or regression models can predict and fill in missing values.
- Correct Errors:
- Typographical Errors: Correct any data entry errors, like typos or incorrect values.
- Consistency Checks: Ensure data is consistent across the data set. For instance, if a person's age is entered as 200, it's likely an error.
- Standardise and Normalise Data:
- Standardisation: Adjust data to have a mean of 0 and a standard deviation of 1, useful for algorithms that assume normally distributed data.
- Normalisation: Scale data to a range, usually between 0 and 1, which is useful when comparing different data sets.
Example: Cleaning Data Suppose you have the following data set of test scores:
Step 1: Identify Outliers:
The score is an outlier.
Step 2: Handle the Outlier:
Investigate the cause. If it's a data entry error, correct or remove it.
Step 3: Handle Missing Data:
If you had a missing value in the test scores, you might replace it with the mean score or use another method.
Step 4: Check for Consistency:
Ensure all scores are within the expected range ( to ).
Cleaning your data ensures that your analysis is based on accurate and reliable data, leading to more trustworthy results.
An outlier is an item of data that lies:
- standard deviations from the mean.
- interquartile ranges from the median.
Example: Cleaning Data with Standard Deivation Let's go through a detailed example to understand how to formally identify outliers using standard deviation.
Question: Using standard deviation, formally identify any outliers in the following set:
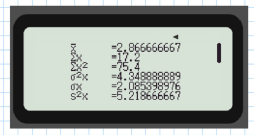
Step 1: Calculate the Mean and Standard Deviation
Using a calculator (shown below), we can find the mean and standard deviation of the data set.
From the calculator screen, we have:
- Mean () =
- Standard deviation (σ) =
Step 2: Determine the Outlier Boundaries
Outliers are defined as data points that lie outside two standard deviations from the mean.
We calculate the boundaries for the outliers using the formula:
Substitute the values of the mean () and standard deviation (σ)
Thus, the boundaries for outliers are: and
Step 3: Identify the Outliers
Any data points that fall outside the range are considered outliers.
Checking the data set:
All of these values lie within the range , so there are no outliers in this data set.
Explanation:
Since no data points lie outside the boundaries of, we conclude that this data set has no outliers.
Example: Identifying Outliers using the IQR Let's go through a detailed example to understand how to identify outliers using the Interquartile Range (IQR).
Question: Using the same data set as before, identify any outliers using the IQR method:
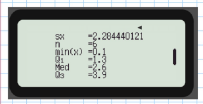
Step 1: Calculate the Median and IQR
The median and quartiles can be found using a calculator. Here's the result:
From the calculator screen, we have:
- Median () =
- Lower quartile () =
- Upper quartile () =
Thus, the IQR (Interquartile Range) is:
Step 2: Determine the Outlier Boundaries
Outliers are defined as any data points that lie 1.5 times the IQR above or below .
We calculate the boundaries for outliers using the formula:
Substitute the values:
Thus, the outlier boundaries are:
Step 3: Identify the Outliers
Any data points that fall outside the range are considered outliers.
Checking the data set:
The value lies outside this range (greater than ), so is an outlier.
Explanation:
Since lies outside the interval , we can conclude that is an outlier in this data set.