Further Correlation & Regression (A Level only) (AQA A-Level Mathematics): Revision Notes
2.5.2 Hypothesis Testing for Correlation
Hypothesis Test for Correlation
When given a sample of data (bivariate), it is possible to calculate how linearly correlated the data are.
Example: Calculate the correlation coefficient of:
Method
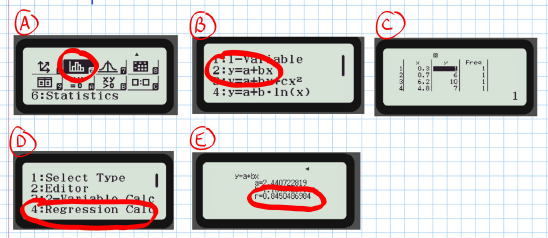
Use a statistical calculator
- A. Select "Statistics" mode.
- B. Choose the "" option for linear regression.
- C. Enter the data values.
- D. Select "Regression Calc".
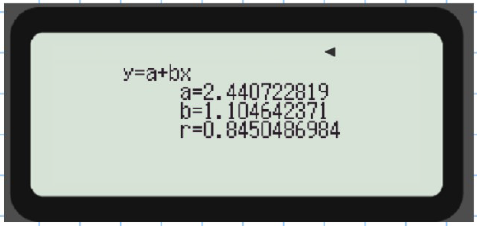
- E. The correlation coefficient is calculated as .
Important Notes
- This sample is relatively small, so any errors in measurement could have significantly inflated/deflated the correlation coefficient.
- We can perform a test to determine whether the correlation exhibited is likely to be just down to chance or whether two sets are truly correlated.
Example: Test at the 2.5% significance level whether the two populations are positively correlated. Step 1: Write out the null and alternate hypotheses:
- (where represents the correlation coefficient of the population, whereas is the correlation coefficient of just the sample).
- (the alternate hypothesis).
- is always "no correlation."
Step 2: Calculate
Step 3: Check this value of against critical values in the table and conclude:
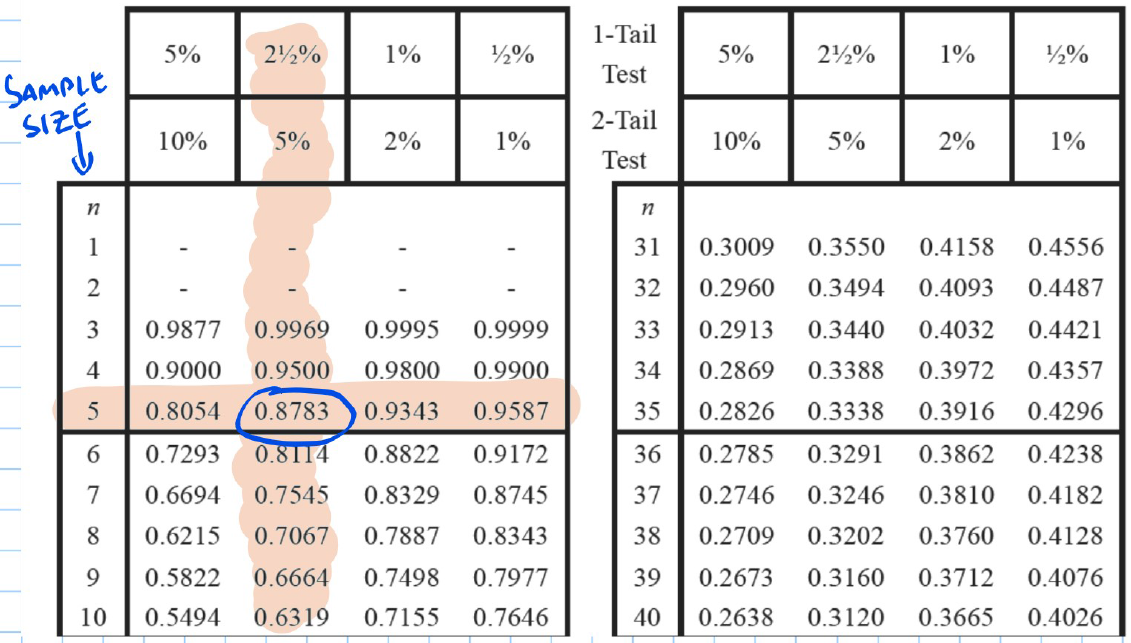
To be 97.5% certain (2.5% significance/uncertainty), we must see to reject
If testing for negative correlation, .
If testing for general correlation, calculate and apply the above rules based on whatever sign has.
Since :
- Do not reject .
- Conclusion: Insufficient evidence to suggest that the two populations are correlated positively.
Example: A computer-controlled milling machine is calibrated between 1 and 7 times a week. A supervisor recorded the number of weekly calibrations, , and the number of manufacturing errors, , in each of 7 weeks.
(a) Calculate the product moment correlation coefficient for these data.
Use a statistical calculator:
- Select "Statistics" mode.
- Choose the "" option for linear regression.
- Enter the data values.
- Select "Regression Calc".
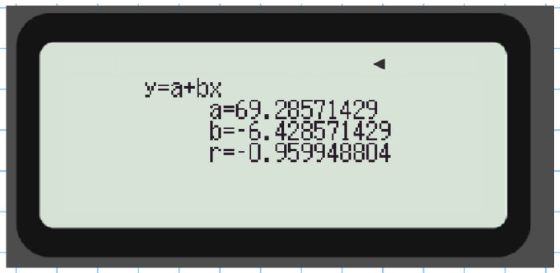
- The correlation coefficient is calculated as .
(b) For these data, test against , using a 1% significance level.
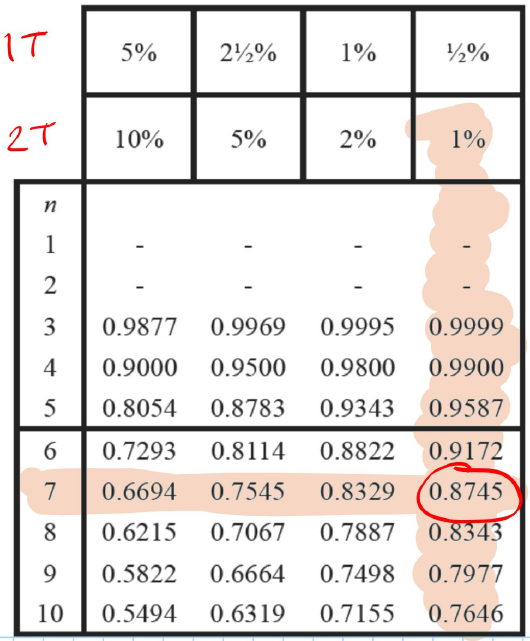
Step 1: Check against the critical values in the table:
We need to compare r with the critical values at the 1% significance level for a one-tailed test.
For a sample size of , the critical value from the table is:
Critical value = 0.8745 (from the 1-tail, 1% column for )
Step 2: Conclude
Reject .
There is sufficient evidence to suggest that the populations are correlated.