Hypothesis Testing (Binomial Distribution) (AQA A-Level Mathematics): Revision Notes
5.2.1 Binomial Hypothesis Testing
In any situation where we are testing a hypothesis, whether it be a drug trial or simply testing figures that a politician is quoting, we always start off with an initial assumption we believe to be true.
Example: It is claimed in an election that a certain party has 40% of the votes. A sample of 10 people were asked what party they vote for, and only 2 said they would vote for that party. Test whether the claim was true.
Hypothesis:
It is suspected that the party's claim of 40% vote share was overstated.
Note: In order to objectively perform the test, we must have a threshold of likelihood below which we reject a claim. This threshold is called the significance level and is usually given as a percentage probability.
We will perform the test at the 5% significance level, meaning any event cumulatively in the bottom 5% of probabilities will lead to rejection of the 40% claim.
Step 1: Define the variable and parameter that we are testing
= "the no. of people voting for the party"
= "the probability of a person voting for the party"
Step 2: Write down the null and alternate hypotheses
We initially believe the claim
The alternative given in the question
Step 3: Test the observed data at the given significance level
In order to perform this test, we check whether the observation of 1 person out of 10 lies in the bottom cumulative 5%.
To do this, since we are testing for , we look at the probability to the left of our observation:
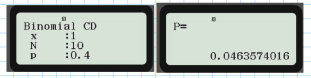
(Where )
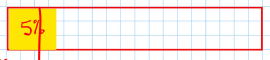
5% Significance Level:
Anything in the bottom 5% (i.e., the rejection region) will lead to a rejection of .
Step 4: Compare observed probability to significance level, then conclude
0.04636 < 0.05 (Key phrase to use: "Reject ")
Sufficient evidence to suggest that the party has less than 40% of the votes.
(This is our alternative hypothesis.)
Common Errors:
- Not initially defining and in words.
- Writing and instead of = and <.
- When performing the test, using instead of .
- Not comparing probability to significance level.
Explanation:
The test we have just performed is called a one-tail test as we are only testing one end of the distribution (i.e., our rejection region was on the left-hand side/left-hand tail). The following is an example of a right-tail test:
Example: A single observation, , is taken from a binomial distribution and a value of 5 is obtained. Use this observation to test against using a 5% significance level.
[Note: since this question has no context, it is not possible to define , or give an in-context conclusion.]
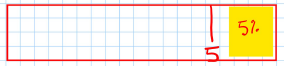
Our observed data was 5 out of 10.
Do not reject . [Note: "Accept " is incorrect.]
In an in-context question, our conclusion would read "insufficient evidence to suggest...".
Example: A dice used in playing a board game is suspected of not giving the number 6 often enough. During a particular game, it was rolled 12 times and only one 6 appeared.
Does this represent significant evidence, at the 5% level of significance, that the probability of a 6 on this dice is less than ?
= "the no. of sixes rolled"
= "probability of rolling a "
0.3813 > 0.05
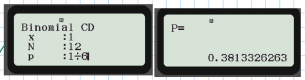
Do not reject
Insufficient evidence to suggest that a 6 being thrown has a probability less than .
Critical Values and Regions
Concept: Critical values and regions are used in hypothesis testing to determine whether to reject the null hypothesis. The critical region is the range of values for which the null hypothesis is rejected, based on the chosen significance level.
Example: Binomial Distribution with a 5% Significance Level Given:
- Binomial distribution
- 5% significance level
Calculation:
%)
%)
%) This is within the 5% significance level
%) This is outside the 5% significance level
Result:
- Critical Values: 0, 1, and 2
- Critical Region:
Example: Testing for Change in the Ratio of Fruit to Mint Flavours at the 10% Significance Level Given:
A sweet manufacturer packs sweets with 70% fruit and the rest mint flavoured. They want to test if there has been a change in the ratio of fruit to mint flavours at the 10% significance level. To do this they take a sample of 20 sweets. What are the critical regions?
= number of fruit sweets. Binomial (20, 0.7)
10% Significance level (2 tailed – 5% at each tail)
Lower Tail:
-
%) Within the 5% lower tail Critical Region , Critical Value
-
%) Outside the 5% lower tail
Upper Tail:
- %)
- %) Within the 5% upper tail Critical Region , Critical Value
Result:
- Critical Region or
- Critical Values: and
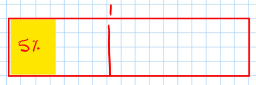
Two-Tailed Binomial Hypothesis Tests
Up to this point, we have only specifically tested for an increase or a decrease in the value of p. In some circumstances, we may not know whether we expect p to be bigger or smaller (i.e., we may just expect it to be different).
Example A machine makes glass bowls, and it is observed that one in ten of the bowls has hairline cracks in them. The production process is modified, and a sample of 20 bowls is taken. One of the bowls is cracked. Test, at the 10% level of significance, the hypothesis that the proportion of cracked bowls has changed as a result of the change in the production process. State your hypotheses clearly.
= "the number of cracked bowls"
= "the probability of a bowl being cracked"
Null Hypothesis:
Alternative Hypothesis:
We don't know whether or
- Significance Level: 5% + 5% = 10% Note: In performing such a test, we go through broadly the same process as in a one-tail test with a few key differences, which will be highlighted.
Calculation:
-
Expected number of cracked bowls in sample: 0.1 × 20 = 2
-
We observed 1 breakage < 2 (expected number).
-
sample size.
Test:
- Testing for decrease in p (i.e., left tail):
Do not reject Insufficient evidence to suggest that the number of cracked bowls has changed.
Example: A standard blood test is able to diagnose a particular disease with a probability of 0.96. A manufacturer suggests that a cheaper test will have the same probability of success. It conducts a clinical trial on 75 patients. The new test correctly diagnoses 63 of these patients. Test the manufacturer's claim at the 10% level, stating your hypotheses clearly.
Step 1: Define the variables and hypotheses.
= "the number of correct diagnoses"
p = "the probability of a correct diagnosis"
Null Hypothesis:
Alternative Hypothesis:
Step 2: Perform the binomial test.
The number of trials , and the success probability under is .
This gives:
Expected number of correct diagnoses = 0.96 × 75 = 72 correct diagnoses.
Observed number of correct diagnoses = 63 (which is less than 72).
We are testing for a decrease (5% each tail).
Step 3: Calculate the probability:
Conclusion:
Reject
There is sufficient evidence to suggest that the success rate for the new test is different from before.
Questions Involving Trial and Improvement
Q2 (June 2006, Q2)
Question A
- The random variable has the distribution .
- A random observation of is found to be 6.
- Test at a 5% significance level the null hypothesis against the alternative hypothesis .
Method:
Calculate the expected value:
Since 6 is greater than the expectation, it's a right-tail test.
Calculate
Compare with the significance level:
Conclusion: Reject .
Question B:
- The random variable has the distribution .
- Test at the same significance level as in part (i).
- A random observation of is found to be 1.
- Use tables to find the largest value of n for which is not rejected.
Method:
- Since 1 is less than the expectation of 2.7, it's a left-tail test.
- Test different values of n to find the largest n where is greater than the significance level:
- (Not rejected).
- (Rejected).
- (Not rejected).
- Conclusion: The largest value of is 9.
Q3 (June 2007, Q7) A Television company believes that the proportion of households that can receive Channel C is 0.35.
Question A:
In a random sample of 14 households it is found that 2 can receive Channel C.
Test, at the 2.5% significance level, whether there is evidence that the proportion of households that can receive Channel C is less than 0.35
Steps:
- Define the hypotheses:
- Model the problem using a binomial distribution: .
- Calculate the probability .
- Compare this probability to the significance level (0.025):
- 0.0839 > 0.025
- Conclusion: Do not reject . There is insufficient evidence to suggest that the proportion of households receiving Channel C is less than 0.35.
Question B:
On another occasion the test is carried out again, with the same hypotheses and significance level as in part (i), but using a new sample, of size .
It is found that no members of the sample can receive Channel C.
Find the largest value of for which the null hypothesis is not rejected.
Show all relevant working.
Steps:
- For each possible sample size , calculate .
- Compare these probabilities to the significance level (0.025):
- (not rejected)
- (rejected)
- (rejected)
- (not rejected)
- Conclusion: The largest n for which is not rejected is n = 8.