Sales, Revenue and Costs (Edexcel A-Level Business): Revision Notes
Sales, Revenue and Costs
Introduction
Understanding sales and costs is fundamental to business decision-making. Every business must track how much it sells, the revenue it generates, and the costs it incurs. This information allows managers to calculate profit, plan for expansion, and make informed strategic decisions. Whether a business produces physical products or delivers services, measuring these financial elements accurately is essential for survival and growth.
The three core financial metrics every business must track are:
- Sales - What is being sold and how much
- Revenue - The monetary value generated from sales
- Costs - The expenses incurred in running the business
Together, these metrics enable businesses to calculate profit and make strategic decisions about pricing, production levels, and expansion.
Sales volume
Sales volume refers to the quantity of units sold by a business over a particular time period. It measures the physical output that a business has successfully sold to customers. The way sales volume is measured depends entirely on the nature of the business and what it produces.
For businesses that produce clearly identifiable units, measuring sales volume is straightforward. For example, a car manufacturer simply counts the number of vehicles sold, while an airline measures sales volume by the number of passengers carried. Different industries use different units of measurement based on what makes sense for their operations.
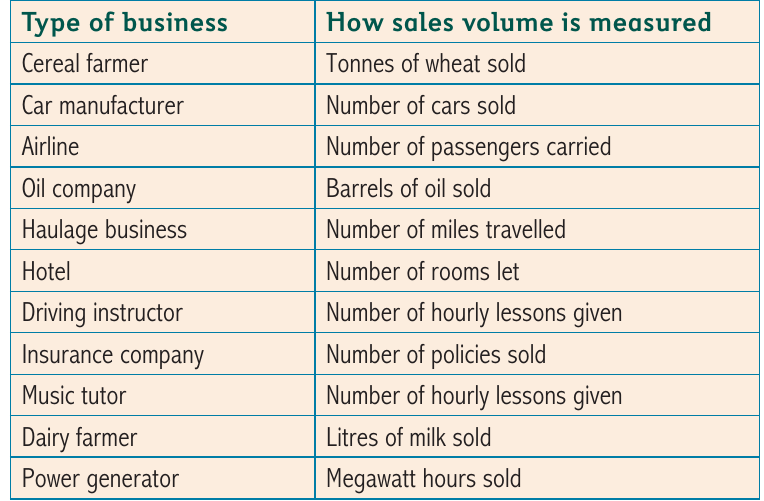
However, not all businesses can easily measure sales volume in simple units. Consider a supermarket that sells thousands of different products daily – from tins of beans to fresh vegetables to clothing. Or think about a construction company that builds houses, apartment blocks, factories, and bridges in a single year. In these cases, the units sold are too diverse to create a meaningful single measure of sales volume. This is where sales revenue becomes a more useful metric.
Why Sales Volume Matters:
Tracking sales volume helps businesses:
- Identify growth trends over time
- Monitor customer demand patterns
- Plan production capacity
- Forecast future sales
- Compare performance across different periods
Example: OzzyTrek
OzzyTrek, an adventure holiday company specializing in Australian outdoor pursuits, provides a good example of sales volume measurement. The company measures its sales volume by counting the number of trips sold. Between 2005 and 2014, OzzyTrek's sales volume showed consistent growth, rising from 250 trips in 2005 to 380 trips in 2014.
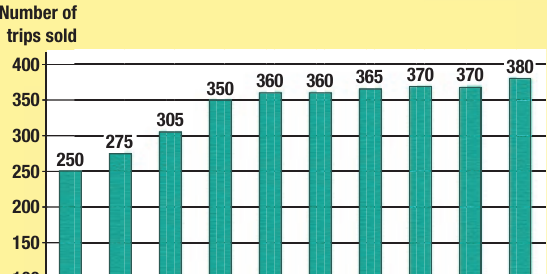
This growth pattern shows how sales volume data helps businesses track performance over time and identify trends in customer demand.
Sales revenue
Sales revenue (also called total revenue) is the monetary value of output sold by a business. It measures not just how many units were sold, but how much money was generated from those sales. Sales revenue can be calculated for any time period – a day, week, month, or year – and for individual products or the entire business.
The formula for calculating sales revenue is:
This formula makes it possible to calculate revenue regardless of how diverse a business's product range might be. By multiplying the price charged by the number of units sold, businesses can determine the total value of their sales.
Worked Example: Gartex Mining Ltd
In 2014, Gartex Mining Ltd sold 1,433,400 tonnes of limestone to customers. The price per tonne was £12.60.
To calculate sales revenue:
This calculation shows how even businesses selling just one product need to use sales revenue to understand the financial value of their output.
OzzyTrek revenue example
Returning to OzzyTrek, we can see how sales revenue differs from sales volume. While the number of trips sold increased steadily, the revenue generated tells a different story.
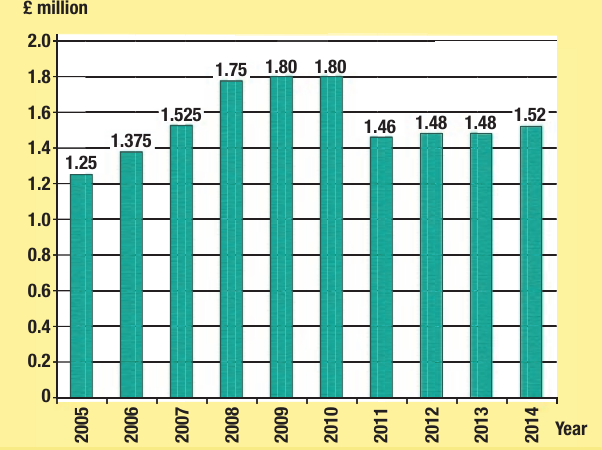
Between 2005 and 2010, OzzyTrek's revenue grew from £1.25 million to £1.80 million. However, in 2011, when the company reduced prices by 20% to boost sales, revenue actually fell to £1.46 million despite selling more trips.
Key Business Principle:
Selling more units doesn't always mean generating more revenue if prices are cut significantly. Businesses must carefully balance price reductions against volume increases to ensure revenue doesn't decline. A 20% price cut requires a substantial increase in sales volume just to maintain the same revenue level.
Real-world example: Manchester United revenue
Even large organizations with multiple revenue streams need to understand their sales revenue composition. Manchester United Football Club generated €350-360 million in the 2012/13 season from three main sources:
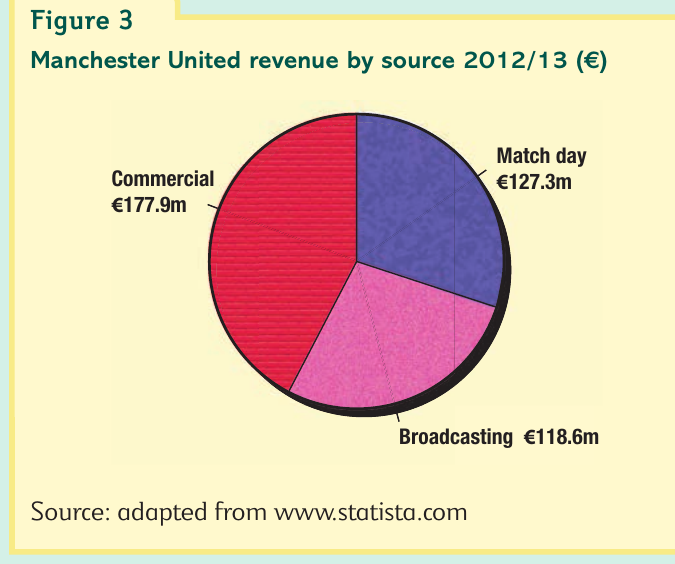
This breakdown shows that commercial activities (€177.9m) generated the most revenue, followed by match day revenues (€127.3m) and broadcasting rights (€118.6m). However, the reality is more complex. Match day revenue alone includes ticket sales, programmes, food and beverages, hospitality boxes, and stadium concessions. Commercial revenue encompasses merchandising, sponsorship deals, advertising, travel packages, stadium tours, and event hosting. This diversity makes measuring sales volume impractical, but sales revenue provides a clear financial picture.
Business costs
Accurate cost information is essential for business decision-making. Before expanding production or launching new services, managers must know exactly how much these activities will cost. Just as individuals track personal expenses like travel and food, businesses must monitor expenses such as wages, raw materials, insurance, and rent.
Understanding costs requires distinguishing between two important time periods: the short run and the long run.
Short run vs long run
The short run is a period where at least one factor of production remains fixed. For example, a manufacturer wanting to increase output can hire more workers and buy more materials, but the factory space and number of machines remain fixed. The business is constrained by its existing capacity.
The long run is a period where all factors of production can vary. The manufacturer can buy a new factory, purchase additional machinery, and hire more staff. This increases capacity and allows greater flexibility, though it also begins a new short-run period with these new fixed factors.
Practical Application:
In service industries, the same principle applies. An airline operating at capacity in the short run can fly more passengers by using its existing planes more frequently. In the long run, it can lease or purchase additional aircraft to expand capacity permanently.
Fixed costs
Fixed costs are costs that remain constant regardless of output levels in the short run. These costs must be paid whether the business produces nothing or operates at full capacity. Common examples include:
- Rent on premises
- Insurance premiums
- Business rates
- Depreciation on equipment
- Machinery and factory costs
- Salaries of permanent staff
- Interest on loans
The term "fixed" means these costs don't change when output changes. However, they may increase over time due to factors like inflation or contract renewals.
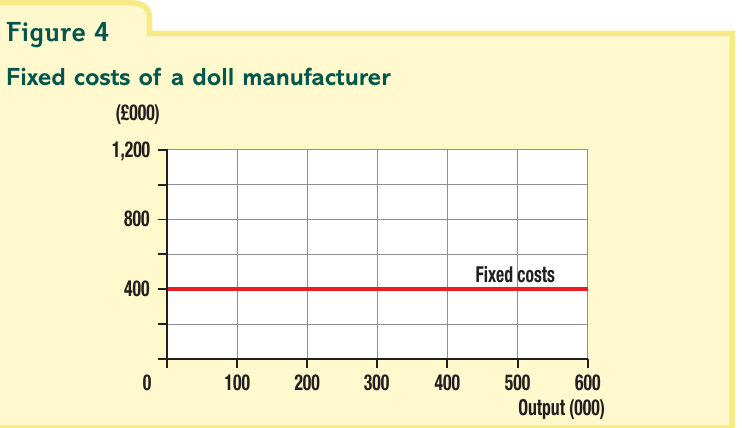
This graph shows fixed costs for a doll manufacturer remaining constant at £400,000 across all output levels from 0 to 600,000 units. The horizontal line demonstrates that fixed costs are incurred even at zero production.
Important Exam Point:
Fixed costs continue even during business shutdowns. If a restaurant owner closes for three weeks in January when trade is slow, fixed costs like rent, insurance, interest payments, and business rates still must be paid. This is a critical concept for understanding business cash flow pressures.
Stepped fixed costs
Over longer time periods, fixed costs can increase in discrete jumps when a business expands capacity. This creates stepped fixed costs.
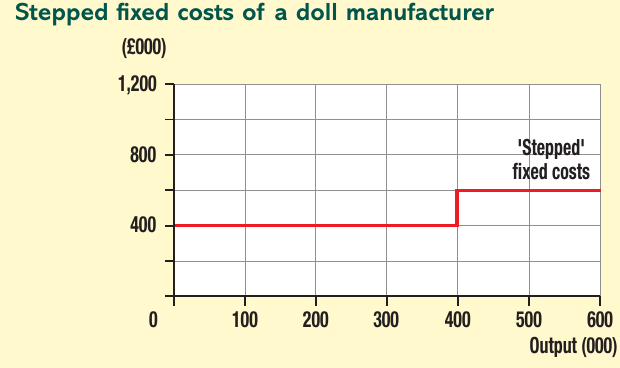
When the doll manufacturer reaches maximum capacity at around 400,000 units, producing more requires investment in additional machinery or factory space. This causes fixed costs to step up from £400,000 to £600,000. The graph shows fixed costs remaining constant within each capacity range but jumping when new capacity is added.
This illustrates how fixed costs can change in the long run, even though they remain fixed within each short-run period. Each "step" represents a new investment in capacity that creates a new level of fixed costs.
Variable costs
Variable costs are costs that rise in direct proportion to output levels. If a business produces nothing, variable costs are zero. As production increases, variable costs increase. Common examples include:
- Raw materials
- Packaging
- Fuel and electricity for production
- Direct labour (workers paid per unit produced)
- Components and parts
For example, a baker producing more loaves needs more flour. An online retailer shipping more orders needs more packaging materials. The direct relationship between output and these costs makes them "variable."
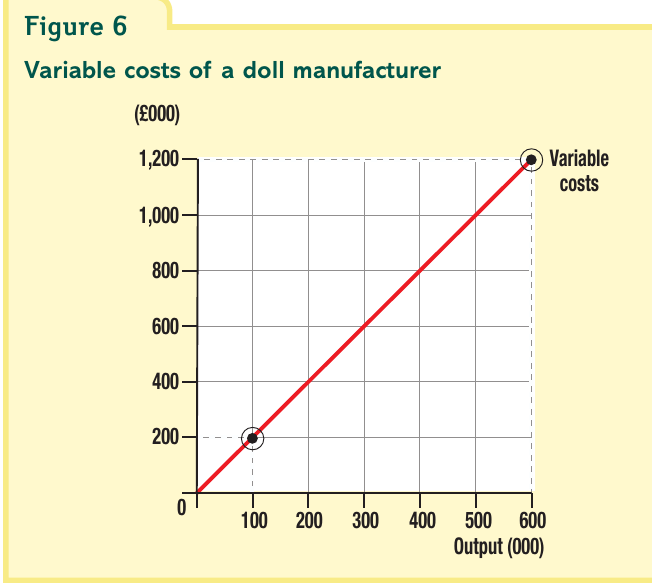
This graph shows the variable costs for the doll manufacturer at £2 per unit. At 100,000 dolls, variable costs total £200,000 (£2 × 100,000). At 600,000 dolls, variable costs reach £1,200,000 (£2 × 600,000). The straight line indicates a constant variable cost per unit – each additional doll costs exactly £2 to produce, regardless of the total output level.
Total cost
Total cost represents the entire cost of producing any given level of output. It combines both fixed and variable costs:
As output increases, total costs rise because variable costs increase, even though fixed costs remain constant. Understanding the composition of total costs helps businesses make pricing and production decisions.
Total Cost Calculation Example
Using the doll manufacturer again with fixed costs of £400,000 and variable costs of £2 per doll:
At 0 output:
At 300,000 dolls:
At 600,000 dolls:
The graph below shows how total costs increase with output. An important insight is that as output rises, fixed costs become a smaller proportion of total costs. At low output, fixed costs dominate. At high output, variable costs make up the majority of total costs.
Average cost (unit cost)
Average cost, also known as unit cost, is the cost of producing each individual unit of output. This metric helps businesses understand their cost efficiency and set appropriate prices. The formula is:
Worked Example: Doll Manufacturer
For the doll manufacturer with fixed costs of £400,000 and variable costs of £2 per unit, if output is 100,000 units:
This means at this output level, each doll costs £6 to produce.
As output increases, average cost typically falls because fixed costs are spread over more units. Understanding average cost is crucial for pricing decisions and profitability analysis.
Profit and loss
One of the primary reasons businesses calculate costs and revenue is to determine profit or loss. Profit represents the financial gain remaining after all costs are subtracted from total revenue.
When total costs exceed total revenue, the business makes a loss (shown as a negative number).
Profit Calculation Example
For the doll manufacturer selling dolls at £5 each, producing 300,000 units with fixed costs of £400,000 and variable costs of £2 per unit:
The business makes a healthy profit of £500,000 at this output and price level.
Loss Calculation Example
If variable costs increased to £4 per unit while everything else remained the same:
The business would lose £100,000 because total costs exceed revenue.
This demonstrates why controlling costs and setting appropriate prices are critical for business survival. Even small changes in variable costs can transform a profitable operation into a loss-making one.
Additional cost concepts
Semi-variable costs
Not all costs fit neatly into fixed or variable categories. Semi-variable costs contain both fixed and variable elements.
Labour costs provide a good example. A permanent employee's salary is a fixed cost regardless of output levels. However, if that employee works overtime during busy periods to increase production, the overtime pay becomes a variable cost tied to output levels.
Telephone charges offer another example, typically consisting of a fixed monthly standing charge plus variable charges based on call volume and usage.
Understanding Semi-Variable Costs:
Semi-variable costs make budgeting more complex because they don't behave predictably like pure fixed or variable costs. Businesses must analyze both components separately to forecast costs accurately at different output levels.
Direct and indirect costs
Costs can also be classified as direct or indirect:
Direct costs can be clearly identified with a particular product or production process. Examples include:
- Raw materials used in a specific product
- Packaging for that product
- Direct labour working on that product
Indirect costs (also called overheads) result from running the entire business and cannot be traced to specific products. Examples include:
- Rent and rates
- General insurance
- Salaries of office staff
- Audit and accounting fees
Generally, indirect costs tend to be fixed costs, while direct costs are usually variable. However, both direct and indirect costs can theoretically be either fixed or variable depending on the circumstances.
Remember!
Key Points to Remember:
- Sales volume measures the quantity of units sold, while sales revenue measures the monetary value (Price × Quantity)
- Fixed costs remain constant in the short run regardless of output (e.g. rent, insurance, business rates)
- Variable costs rise directly with output and are zero when output is zero (e.g. raw materials, packaging)
- Total cost = Fixed costs + Variable costs
- Average cost = Total cost ÷ Output – this shows the cost per unit produced
- Profit = Total revenue - Total costs – when this is negative, the business makes a loss
- In the short run, at least one factor of production is fixed; in the long run, all factors can vary
- Fixed costs can increase in steps when capacity expands in the long run
- Semi-variable costs contain both fixed and variable elements (e.g. labour with overtime, telephone charges)