The Nature of Demand (Edexcel A-Level Economics A): Revision Notes
The Nature of Demand
Introduction
Understanding how demand works is fundamental to studying economics. The demand and supply model helps explain how markets operate in the real world and is one of the most important analytical tools in economics. This note focuses on the demand side of this model, examining what influences consumer decisions and how these decisions shape market outcomes.
The demand and supply model is arguably the most powerful tool in economics for understanding how markets function. While we focus on demand here, remember that supply is equally important - markets are determined by the interaction of both forces.
Rational decision making
Before examining demand, it's important to understand the assumptions economists make about how people make choices. These assumptions help build models that predict economic behaviour.
Consumer behaviour
Economists assume that consumers aim to maximise their utility (satisfaction). When you decide which products to buy, you're seeking to gain as much satisfaction as possible from the combination of goods you consume. This assumption that consumers act rationally to maximise utility forms the foundation of demand analysis.
Firm behaviour
Similarly, firms are assumed to aim for maximum profit. Profit is calculated as the total revenue from selling products minus the total cost of production. In other words, firms aim to maximise the difference between what they earn and what they spend.
Why these assumptions matter
These assumptions of rational behaviour are crucial because they allow economists to build predictive models. If we know consumers seek maximum satisfaction, we can anticipate how they'll respond to price changes or income changes. Without such assumptions, we couldn't understand or predict economic behaviour.
Critical Assumption Alert:
While these assumptions simplify reality, they provide a useful starting point for economic analysis. Be aware that people don't always behave rationally – a topic explored in behavioural economics. In exams, you may need to discuss both the usefulness of these assumptions and their limitations.
What is demand?
Demand refers to the quantity of a good or service that consumers are willing and able to buy at any given price during a specific time period. It's important to note both "willing" and "able" – a consumer must both want the product and have the money to purchase it.
The distinction between "willing" and "able" is crucial. You might want a Ferrari (willing), but if you can't afford it (not able), this doesn't constitute demand in economic terms. Demand requires both desire and purchasing power.
Several factors influence how much of a product you choose to buy:
- The price of the good – This is the primary influence and affects the quantity you choose to buy
- The price of other goods – Particularly substitute products or complementary products
- Your income – This determines how much you can afford to purchase
- Your preferences – Everything else that influences whether you like or dislike a product
Think about your own purchasing decisions. When considering buying a product, you probably think about whether you can afford it, whether there are cheaper alternatives, whether you really need it, or whether your friends have it. All these factors shape your demand for the product.

Demand and the price of a good
Let's focus on how price affects demand, assuming all other factors remain constant (using the economic principle of ceteris paribus, meaning "other things being equal").
Marginal utility and diminishing marginal utility
When you consume a product, you gain utility (satisfaction) from it. However, the additional satisfaction you gain from consuming one more unit – known as marginal utility – typically decreases as you consume more of the product.
Worked Example: Understanding Diminishing Marginal Utility
Think about eating chocolate bars:
- First chocolate bar: Provides lots of satisfaction (high marginal utility)
- Second chocolate bar: Still enjoyable, but less additional satisfaction than the first
- Third chocolate bar: Even less additional satisfaction
- Fifth or sixth bar: Very little extra satisfaction, or you might even feel unwell!
This demonstrates diminishing marginal utility – you gain less additional satisfaction from each successive unit consumed.
This is called diminishing marginal utility – the situation where you gain less additional utility from consuming a product the more of it you've already consumed.
This pattern influences how much you're willing to pay for additional units. Because extra units give you less satisfaction, you'd only be willing to pay lower prices for larger quantities.
The law of demand
This relationship between price and quantity demanded is so consistent that it's known as the law of demand: there is an inverse relationship between the quantity demanded and the price of a good or service, ceteris paribus. In simpler terms, when prices rise, people tend to buy less; when prices fall, people tend to buy more.
The Law of Demand is Fundamental:
The inverse relationship between price and quantity demanded is one of the most reliable patterns in economics. Almost all goods and services follow this law. Understanding this relationship is essential for analyzing how markets function and predicting consumer behaviour.
The demand curve
We can illustrate this relationship using a demand curve – a graph showing how much of a good consumers will demand at any given price.
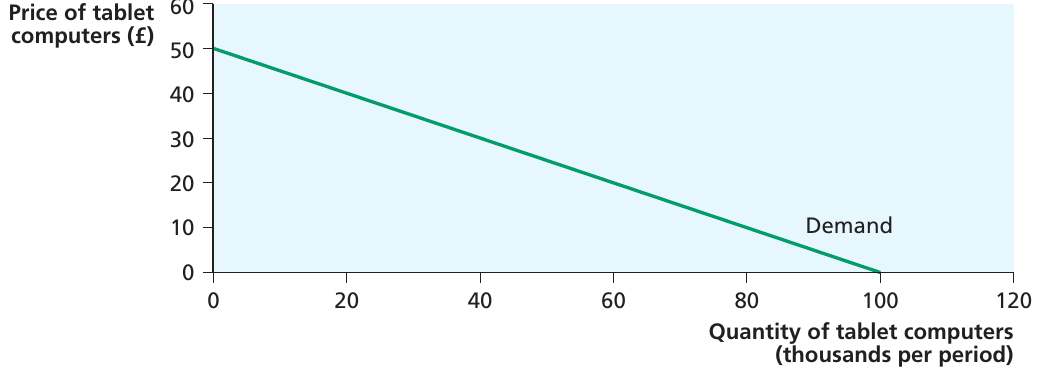
The demand curve for tablet computers shown above slopes downwards from left to right. This downward slope reflects the law of demand: as price decreases, quantity demanded increases.
Here's the data behind this demand curve:
| Price (£) | 100 | 90 | 80 | 70 | 60 | 50 | 40 | 30 | 20 |
|---|---|---|---|---|---|---|---|---|---|
| Quantity | 0 | 3 | 7 | 15 | 25 | 40 | 60 | 85 | 120 |
At £100, no tablets are demanded. As the price falls to £20, demand increases to 120,000 tablets per period. This demonstrates the inverse relationship between price and quantity demanded.
Reading a Demand Curve:
When reading a demand curve, remember that price is shown on the vertical axis and quantity on the horizontal axis. To find the quantity demanded at a particular price, locate the price on the vertical axis, then read across to where this meets the demand curve, then read down to find the corresponding quantity. Practice this skill as it's frequently tested in exams.
Movements along and shifts in the demand curve
Understanding the difference between movements along a demand curve and shifts of the entire curve is crucial for economic analysis.
Movements along the demand curve
When the price of a good changes (and all other factors remain constant), we observe a movement along the demand curve. Economists use specific terminology:
- An extension of demand occurs when price falls and quantity demanded increases (movement down and to the right along the curve)
- A contraction of demand occurs when price rises and quantity demanded decreases (movement up and to the left along the curve)
Shifts of the demand curve
When any factor other than price changes, the entire demand curve shifts to a new position. This is called a change in demand:
- An increase in demand means the curve shifts to the right (more is demanded at every price)
- A decrease in demand means the curve shifts to the left (less is demanded at every price)
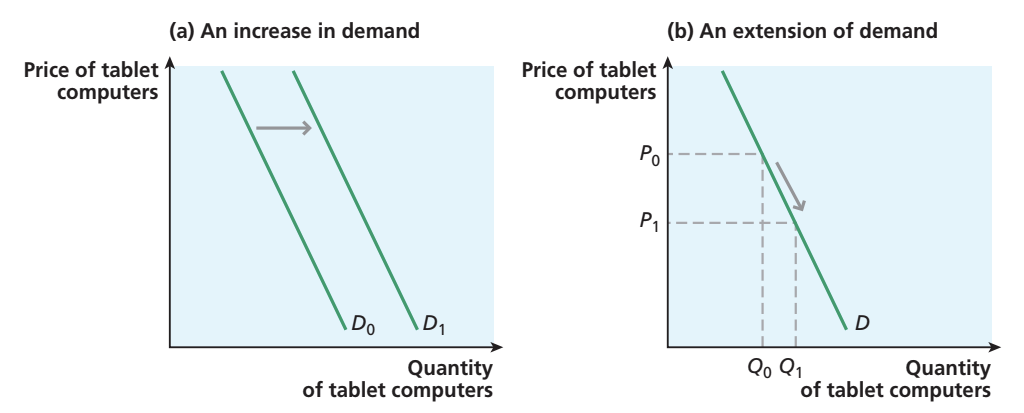
The diagram above illustrates this crucial distinction. Panel (a) shows a rightward shift of the entire demand curve, representing an increase in demand. Panel (b) shows a movement along a single demand curve, representing an extension of demand following a price fall.
Critical Distinction - Movements vs Shifts:
This is one of the most common sources of confusion in economics:
- Price changes cause movements along the curve (extension or contraction)
- Other factors changing cause shifts of the entire curve (increase or decrease in demand)
Always use the correct terminology. Using precise language demonstrates your understanding and earns marks in exams. Confusing these concepts will cost you marks.
Factors that shift the demand curve
Let's examine the main factors that cause the demand curve to shift position. These are sometimes called the conditions of demand.
Consumer incomes
Changes in consumer income significantly affect demand for most products, but the direction of the effect depends on the type of good.
Normal goods
A normal good is one where quantity demanded increases when consumer incomes rise. Most products fall into this category. For example, foreign holidays are a normal good – as people's incomes increase, they tend to demand more holidays abroad at any given price.
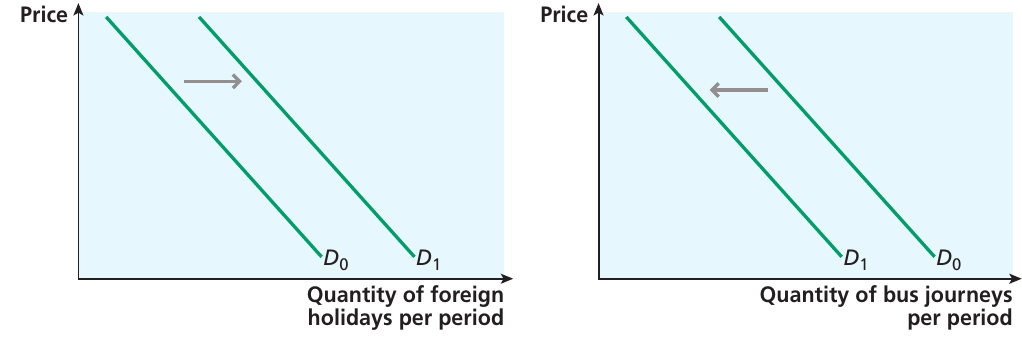
The left panel shows the market for foreign holidays. When consumer incomes increase, the demand curve shifts rightward from D₀ to D₁, meaning consumers demand more holidays at every price level.
Most goods and services in an economy are normal goods. Think about your own consumption – as your income increases (perhaps from a part-time job or allowance), you likely buy more of most things: clothes, entertainment, meals out, etc. This normal relationship between income and demand is why economic growth (rising incomes) typically leads to increased consumption across most sectors.
Inferior goods
An inferior good is one where quantity demanded decreases when consumer incomes rise. These are typically basic or lower-quality products that people buy less of when they can afford better alternatives.
Bus journeys provide a good example. As people's incomes rise, they may switch to using taxis or buying their own cars, reducing their demand for bus travel at any given price.
The right panel in the diagram above shows how the demand curve for bus journeys shifts leftward from D₀ to D₁ following an increase in consumer incomes.
Don't Misunderstand "Inferior":
Don't confuse "inferior" with "poor quality". An inferior good simply means demand falls as income rises. The good itself might be perfectly satisfactory; it's just that consumers switch to alternatives when they can afford them. Examples include:
- Own-brand supermarket products (when people can afford branded items)
- Public transport (when people can afford cars)
- Cheap cuts of meat (when people can afford premium cuts)
Extension: the Veblen effect

For some luxury goods, a "snob effect" or conspicuous consumption effect may occur. This was identified by economist Thorstein Veblen in the nineteenth century. Some people value certain goods more highly simply because they're expensive, as this signals wealth and status to others. Luxury watches like Rolex might benefit from this effect.
While individual consumers may behave this way, there's no evidence that entire markets display upward-sloping demand curves for this reason. Most consumers respond normally to price changes in these markets. The Veblen effect is an interesting exception to typical consumer behaviour, but it doesn't invalidate the law of demand at the market level.
The price of other goods
Demand for a product can be affected by changes in the prices of related goods. There are two main types of relationships:
Substitute goods
Substitutes are products that can replace each other. Two goods are substitutes if demand for one good is likely to rise when the price of the other increases. For example, tea and coffee are substitutes for many consumers – if either becomes significantly cheaper, people may switch their consumption.
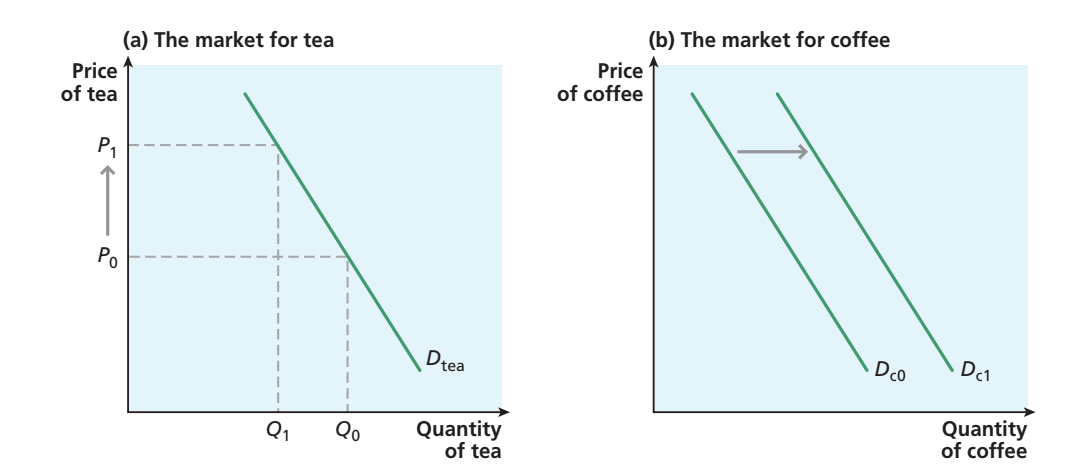
The diagram shows the tea and coffee markets. When the price of tea increases from P₀ to P₁ (left panel), some consumers switch to coffee. This causes the demand curve for coffee to shift rightward from Dc0 to Dc1 (right panel), as coffee becomes relatively more attractive.
Other examples of substitutes include:
- Different brands of breakfast cereals
- Butter and margarine
- Different smartphone brands
Worked Example: Analyzing Substitute Goods
Suppose the price of beef increases by 30% due to supply shortages:
Step 1: Identify the effect on beef demand
- Movement up along the beef demand curve (contraction of demand)
- Consumers buy less beef at the higher price
Step 2: Identify the substitute goods
- Chicken, pork, lamb are substitutes for beef
Step 3: Analyze the effect on substitutes
- Consumers switch from beef to these alternatives
- Demand curves for chicken, pork, and lamb shift rightward
- More of these products demanded at every price level
Result: Beef consumption falls; chicken, pork, and lamb consumption increases
Complementary goods
Complements are products consumed together. Two goods are complements if an increase in the price of one good causes the demand for the other to fall. For example, cars and petrol are complements – if cars become very expensive, demand for petrol will fall as fewer people own cars.
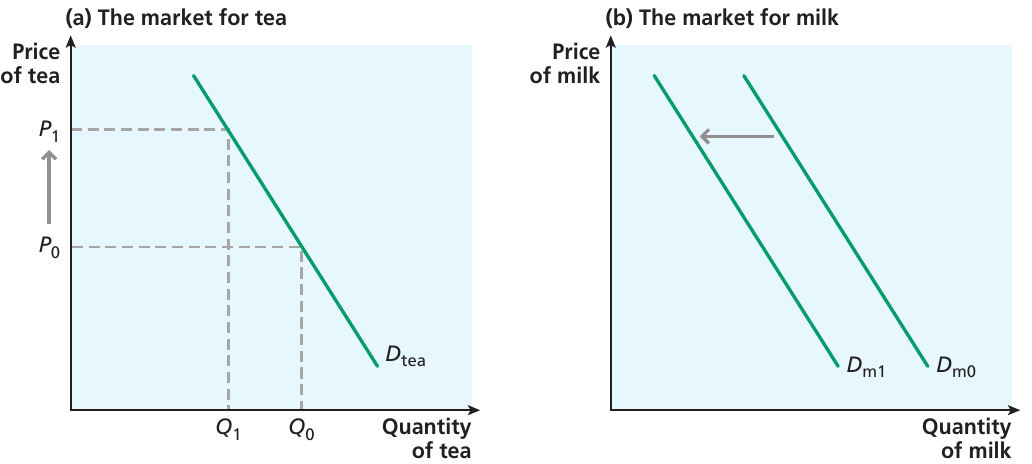
This diagram illustrates tea and milk as complementary goods. When the price of tea increases from P₀ to P₁ (left panel), people buy less tea. This reduces demand for milk (right panel), shifting the demand curve leftward from Dm0 to Dm1.
Other examples of complements include:
- Breakfast cereals and milk
- DVD players and DVDs
- Tennis rackets and tennis balls
To determine if two goods are substitutes or complements, ask yourself: "If the price of good A rises, would I buy more or less of good B?"
- More of good B: A and B are substitutes (you're switching from A to B)
- Less of good B: A and B are complements (you use them together)
Consumer preferences
Almost any other factor influencing demand can be categorised as part of consumer preferences. These are the personal inclinations that determine whether you like or dislike a product.
Several factors can influence preferences:
- Personal tastes – Some people prefer dark chocolate while others prefer milk chocolate. These personal inclinations vary between individuals.
- Advertising and branding – Firms invest heavily in advertising to influence consumer preferences. Successful advertising campaigns can shift demand curves rightward by making products more desirable.
- Fashion and trends – Some people follow fashion trends, which can significantly influence demand. However, others deliberately reject trends.
- Social influences – Peer pressure and social norms can affect demand. You might be more likely to buy a product if your friends have it, or less likely to buy something if you want to stand out.
Preferences can change suddenly, causing rapid shifts in demand. A product might become fashionable, causing a surge in demand, or fall out of favour, causing demand to collapse.
Consumer preferences are often the most volatile and unpredictable factor affecting demand. While income and prices change gradually and predictably, preferences can shift rapidly due to trends, social media, celebrity endorsements, or viral marketing. This unpredictability makes demand forecasting challenging for businesses.
The effect of time
For certain products, the timing of purchase matters. Not all goods are consumed immediately – some are bought as investments or in anticipation of future events.
Some consumers buy products expecting prices to rise in the future. For example:
- Fine wine or works of art purchased as investments
- Housing purchased before expected price increases
- High-tech products like smartphones, though these may be bought quickly before prices fall as production increases
Additionally, consumption patterns vary over time. Some goods aren't consumed instantly but over long periods. This can affect when purchases are made and how demand responds to price changes.
Timing and Consumer Expectations:
When analysing demand changes, consider whether consumers might delay purchases in expectation of future price reductions, or accelerate purchases to avoid expected price increases. This is particularly relevant for:
- Durable goods (cars, appliances, electronics)
- Investment goods (property, art, collectibles)
- Seasonal products (winter clothing, holiday bookings)
Consumer expectations about future prices can significantly influence current demand.
Individual and market demand
So far, we've discussed demand from an individual consumer's perspective. However, economists are often interested in market demand – the total demand from all potential buyers.
Market demand for a product (such as tablet computers) represents the combined demand from all potential buyers in the market. It can be calculated by adding up the quantities that all individual consumers would buy at each price level.
The same four factors that influence your individual demand (price, price of other goods, income, and preferences) also influence market demand. Additionally, the number of potential buyers in the market affects total market demand. More potential buyers means greater market demand at any given price.
Market demand is the horizontal summation of all individual demand curves. If at a price of £10, Consumer A demands 5 units, Consumer B demands 3 units, and Consumer C demands 7 units, then market demand at £10 is 15 units (5 + 3 + 7). This same calculation is performed at every price level to construct the market demand curve.
Summary
Key Concepts About Demand:
-
Demand depends on the price of the good, the price of other goods, consumer incomes, preferences, and the number of potential consumers
-
The demand curve shows the relationship between demand for a product and its price, ceteris paribus
-
The demand curve slopes downward, reflecting the inverse relationship between price and quantity demanded (the law of demand)
-
A price change causes a movement along the demand curve (extension or contraction of demand)
-
Changes in other factors cause shifts of the entire demand curve (increases or decreases in demand)
-
Normal goods see increased demand when incomes rise; inferior goods see decreased demand when incomes rise
-
Substitute goods can replace each other; complementary goods are consumed together
-
For some products, demand may be affected by expectations about future prices
Remember!
Essential Points to Master:
-
Demand means both willing AND able to buy – it's not the same as just wanting something
-
The law of demand states there's an inverse relationship between price and quantity demanded (higher prices → lower quantity demanded)
-
Movement vs shift:
- Price changes = movement along the curve
- Other factors changing = shift of the curve
-
Normal goods: income rises → demand increases
Inferior goods: income rises → demand decreases
-
Substitutes: when one becomes more expensive, demand for the other increases
Complements: when one becomes more expensive, demand for the other decreases