How Markets Work (Edexcel A-Level Economics A): Revision Notes
The Price Mechanism in Action
Introduction
This note explores how the demand and supply model works in practice across different types of markets. Understanding these applications helps you see how economic theory explains real-world market behaviour at local, national, and global levels. You'll discover how markets respond to changes in conditions, how government intervention through taxes and subsidies affects outcomes, and whether consumers always make rational economic decisions.
The price mechanism works across diverse markets, from agricultural products affected by weather to global commodity markets, from housing to foreign exchange. Each market has unique characteristics, but the fundamental principles of supply and demand remain applicable throughout.
Agricultural markets
Agricultural markets demonstrate interesting characteristics that can be analyzed using supply and demand analysis. A key feature of many agricultural markets is that supply can be strongly affected by unpredictable factors such as weather and climate conditions.
Supply volatility in agriculture
Weather patterns create significant volatility in agricultural supply. Good weather conditions lead to abundant harvests, whilst poor weather reduces crop yields. This unpredictability makes it difficult to forecast market outcomes in advance. Prices can vary considerably from year to year, creating uncertainty for both farmers and consumers.
The supply-side nature of this volatility means that farmers face particular challenges. They cannot easily adjust their planting decisions once crops are in the ground, and external factors largely determine their harvest outcomes. Some commodities attempt to address this through storage systems, where surplus produce from good years is stored to sell during poor harvest years, helping to stabilize prices over time.
Exam tip: When analyzing agricultural markets, always consider the time lag between planting decisions and harvest outcomes. Supply is relatively inelastic in the short run because farmers cannot quickly change production levels once planting has occurred.
Commodity markets
Commodity markets trade raw materials used in manufacturing industries. Unlike agricultural markets where supply causes most volatility, commodity markets often experience volatility on the demand side.
Demand fluctuations in commodity markets
Demand for commodities tends to vary with business cycles. During economic booms, manufacturing activity increases, raising demand for raw materials. During recessions, demand falls as production slows. This cyclical pattern creates significant price movements in commodity markets.
An important feature of commodity markets is the existence of futures markets. These allow commodities to be bought in the present period for delivery at a future date, with prices agreed in advance. This adds a speculative element to demand, as traders attempt to profit from anticipated price movements.
The market for bauxite
Bauxite serves as the principal source of aluminum, making it an important industrial commodity. Many countries experience fluctuations in overall economic activity over time, alternating between periods of boom and recession.


The diagram illustrates how the bauxite market responds to cyclical demand changes. The supply curve remains relatively stable and inelastic, meaning suppliers cannot easily adjust production quantities. Three demand curves represent different economic conditions:
- Peak demand (): During economic booms, demand is high, pushing prices to
- Average demand (): Normal economic conditions produce moderate prices at
- Trough demand (): During recessions, demand falls, reducing prices to
Because supply is relatively inflexible, the main adjustment to changing economic conditions occurs through price movements rather than quantity changes. The quantity traded doesn't vary dramatically between and , but prices show much larger fluctuations.
The market for oil
Oil markets have particular significance for the global economy because oil is essential for transportation and many other economic activities. The market operates globally, though oil reserves are concentrated in relatively few countries.
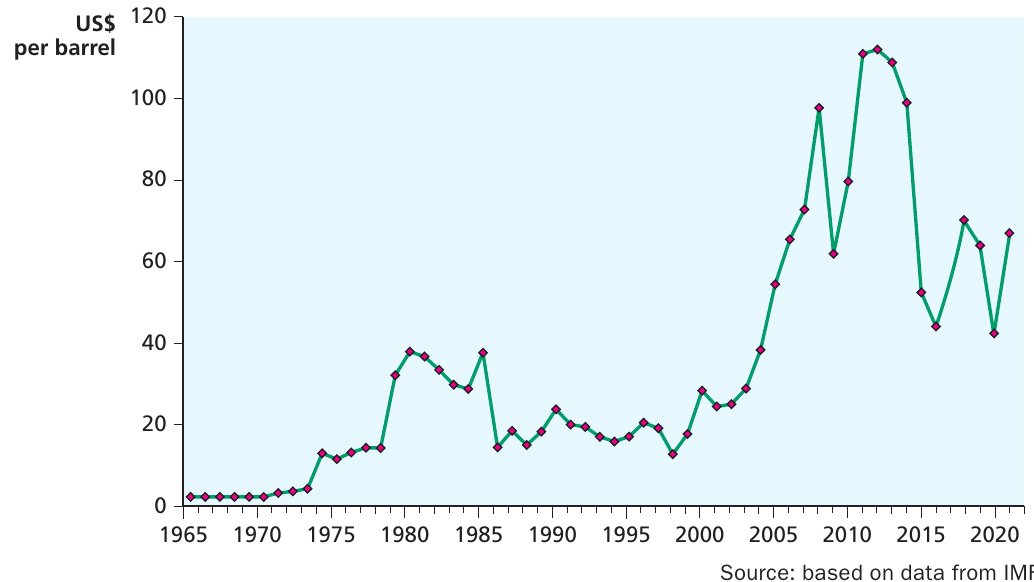
The historical price data reveals an erratic path with several notable features:
- 1965-1973: Prices remained low and stable, under $5 per barrel
- 1973-1980: Sharp price spike to nearly $40 following the Yom Kippur conflict and OPEC interventions
- 1980-2000: Gradual decline and stabilization at lower levels
- 2000-2008: Dramatic rise to approximately $110 per barrel
- 2008-2009: Rapid fall during the financial crisis
- 2010-2014: Recovery to around $110 per barrel
- 2014-2020: Significant decline and continued volatility
These price movements reflect both supply disruptions (wars, OPEC restrictions) and demand changes (rapid growth in China's economy, COVID-19 pandemic demand collapse). The extreme volatility demonstrates how sensitive oil prices are to changes in global economic and political conditions.
Case study: The Organization of Petroleum Exporting Countries (OPEC) operates as a cartel that coordinates production among major oil-producing nations to influence prices. By restricting supply, OPEC can push prices higher, demonstrating how market power can affect outcomes.
The housing market
Housing represents a major component of household budgets, making the housing market particularly important for economic well-being. The market operates primarily at a local level, responding to specific regional characteristics, though national factors also play a role.
Market segments
The housing market isn't a single unified market but consists of different segments:
- Owner-occupier market: People buying homes to live in
- Private rental sector: Landlords renting properties to tenants
- Public rental sector: Council housing and housing associations
These segments interact but respond to different factors. Understanding the owner-occupier market is particularly important because home purchase represents the largest single transaction most people make.
The owner-occupier market
House purchases typically require borrowing through mortgages. This means the cost of borrowing (the interest rate) significantly influences demand for houses. When interest rates are low, borrowing is cheap, encouraging people to buy, which shifts the demand curve to the right. When interest rates rise, the cost of mortgage payments increases, making homeownership less affordable and reducing demand.
In the early twenty-first century, historically low interest rates encouraged borrowing and fed strong demand for houses. However, following the recovery from the pandemic and the Ukraine conflict in 2022, rising inflation led to interest rate increases. This created difficulties for many homeowners trying to meet their mortgage commitments.
Supply constraints in housing
Supply of houses expands relatively slowly for several reasons:
- Construction time: Building houses takes considerable time
- Environmental concerns: Regulations limit development to protect the environment
- Planning restrictions: Controls on new housing stock growth
These factors mean supply is relatively inelastic in the short run.
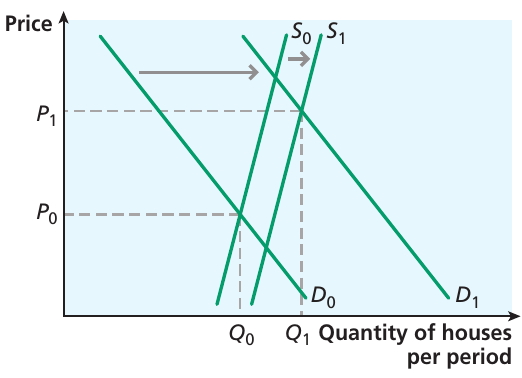
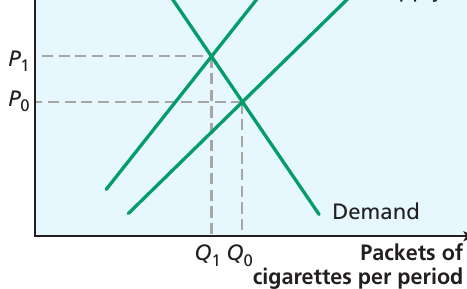
The diagram shows market dynamics when demand increases rapidly whilst supply expands slowly:
- Initial equilibrium at price and quantity
- Demand increases from to (due to factors like low interest rates)
- Supply expands from to (but by a smaller amount due to construction constraints)
- New equilibrium at higher price and quantity
The relatively small supply response compared to the demand increase results in significant price rises. This pattern characterized the late 1990s and early 2000s, with rapid house price increases and speculation about sustainability. The 2007-2009 financial crisis proved prices had risen too quickly, leading to a significant correction.
After a mild recovery and period of stagnation, house prices rose again during the COVID-19 lockdown as people sought extra living space.
Study tip: The housing market provides an excellent example of how markets operate at the local level whilst being influenced by national factors (like interest rates). Regional variations in house prices reflect local supply and demand conditions. This makes it relevant for discussing both local and national market dynamics in exams.
Exam tip: When analyzing housing markets, remember that both demand factors (income, interest rates, population growth) and supply factors (construction rates, planning regulations, land availability) need consideration. The interaction determines price movements.
The foreign exchange market
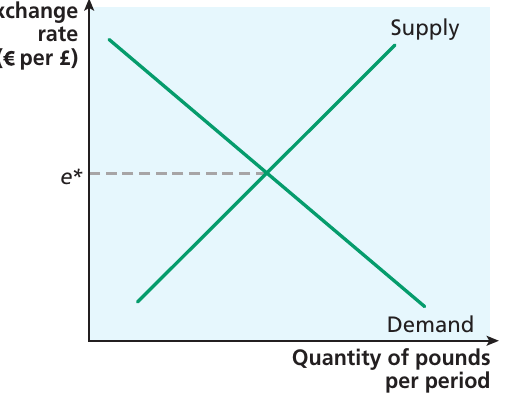
When you holiday abroad, you need to exchange your home currency for the currency of your destination country. This exchange takes place in the foreign exchange market. The exchange rate represents the price at which two currencies trade, and this price can be analyzed using supply and demand principles.
Demand for pounds sterling
Consider the market for pounds, focusing on the exchange rate between pounds and euros. The demand for pounds comes from anyone holding euros who wants to buy British goods, services, or assets. This includes:
- German tourists needing pounds to spend on holiday in the UK
- European consumers wanting to buy British products
- European investors purchasing UK assets
When the exchange rate for pounds (measured in euros per pound) is high, potential buyers receive relatively few pounds for each euro. This makes British goods expensive for them. When the euros-per-pound rate is relatively low, they receive more pounds for their euros, making British goods more affordable. This explains why the demand curve slopes downward.
Supply of pounds sterling
The supply of pounds comes from UK residents who want euros to buy goods, services, or assets from Europe. From this perspective, when the euros-per-pound rate is high, UK residents receive more euros for their pounds, encouraging them to supply more pounds to the market.
If the exchange market is in equilibrium, the exchange rate settles at , where the quantity of pounds demanded equals the quantity supplied.

Foreign exchange as derived demand
An important concept here is that the foreign exchange market exemplifies derived demand. People don't want pounds for their own sake but for the goods, services, or assets they can purchase with them. This notion of derived demand appears in other contexts too, such as the demand for labor, which exists because firms want what workers can produce.
The exchange rate serves as one way to understand the international competitiveness of British exports. When the exchange rate is high, British goods become less competitive in Europe (and elsewhere), ceteris paribus. However, competitiveness also depends on relative price levels in the UK and other countries.
Exam tip: Remember that exchange rate changes have multiple effects. A higher exchange rate makes exports more expensive for foreign buyers (reducing demand) but makes imports cheaper for domestic buyers (increasing demand for foreign goods).
Financial markets
Money plays a crucial role in enabling exchange through market operations. This suggests that people have a demand for money, associated with money's functions as a medium of exchange, store of value, unit of account, and standard of deferred payment.
The demand for and supply of money
The demand for money depends partly on the number of transactions people wish to undertake, which relates to income levels. But is there a price for money?
The price of money can be viewed as an opportunity cost. When people hold money, they incur an opportunity cost because they could instead purchase a financial asset providing a rate of return (the interest rate). This interest rate can thus be interpreted as the price of holding money.
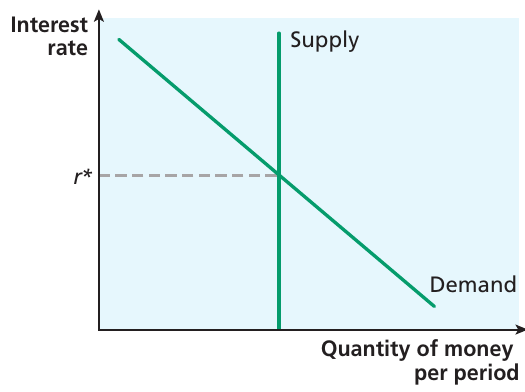
The money market diagram shows:
- Demand for money: Slopes downward because higher interest rates increase the opportunity cost of holding money, reducing the quantity demanded
- Supply of money: Shown as a vertical line because the Bank of England determines the money supply, which doesn't depend on the interest rate
- Equilibrium interest rate: , where demand equals supply
The interest rate adjusts to ensure the money market reaches equilibrium. This mechanism becomes important for understanding how monetary policy works, as the central bank can influence interest rates by adjusting the money supply.
Study tip: Interest rates affect multiple markets simultaneously. They influence the housing market (through mortgage costs), the money market (as the price of money), and the wider economy (through effects on inflation). You may encounter interest rate discussions when analyzing different market situations.
Indirect taxes and subsidies
Governments intervene in markets through various mechanisms. Indirect taxes and subsidies represent important forms of intervention that can be analyzed using supply and demand models.
Indirect taxes
An indirect tax is a tax levied on expenditure on goods or services, paid by the seller. This contrasts with a direct tax, which is charged directly on individuals based on their income.
In the UK, Value Added Tax (VAT) is the most prominent indirect tax, though excise duties on products like alcohol and tobacco also represent indirect taxes. An indirect tax effectively increases costs for producers, affecting the supply curve.
Specific taxes
A specific tax is a sales tax set at a constant amount per unit of sales. Consider the example of a tax on cigarettes.
Without the tax, market equilibrium occurs at the intersection of demand and supply, with price and quantity . The tax affects firms' willingness to supply cigarettes. For any given quantity, firms now need to receive the tax amount over and above the price they would previously have accepted. This shifts the supply curve upward by the amount of the tax.
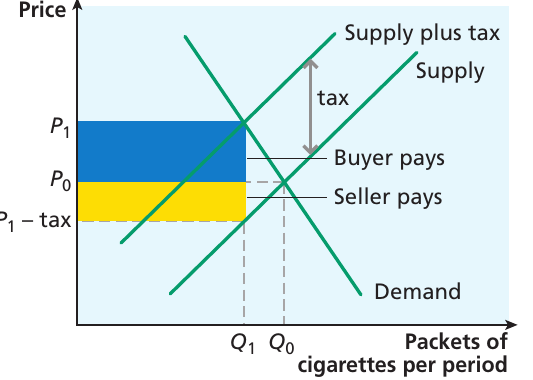
The new equilibrium occurs at:
- Price paid by buyers: (higher than )
- Quantity traded: (lower than )
- Price received by sellers: (lower than )
The diagram shows two important areas:
- Blue shaded area (Buyer pays): The portion of tax burden falling on consumers through higher prices
- Yellow shaded area (Seller pays): The portion of tax burden falling on producers through lower net receipts
Tax incidence
A crucial question is: who bears the burden of the tax? The incidence of a tax refers to how the tax burden divides between buyers and sellers.
Looking at the diagram, the price difference between with-tax and without-tax situations () is less than the full tax amount. This means part of the tax is passed on to buyers in the form of higher prices, whilst sellers bear the remainder.
The elasticity of demand determines tax incidence. If demand were perfectly inelastic, sellers could pass the entire tax burden onto buyers through price increases equal to the tax, knowing quantity demanded wouldn't change. If demand were perfectly elastic, sellers couldn't raise prices at all without losing all customers, so they would bear the entire tax burden.
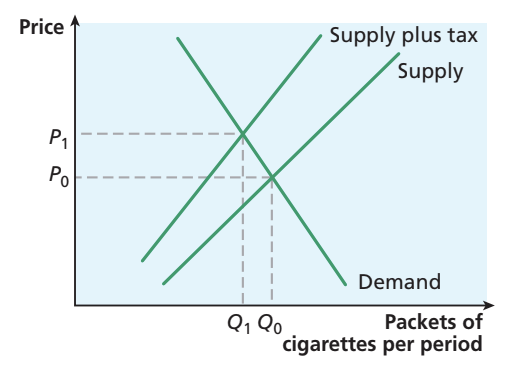
Ad valorem taxes
An ad valorem tax is a sales tax set at a percentage of the price. This type of tax also affects the supply curve, but differently from a specific tax. Because the tax is a percentage, the vertical distance between the original supply curve and the "supply plus tax" curve increases as price increases, making the supply curve steeper.
Exam tip: When asked to analyze tax effects, remember to:
- Identify whether it's a specific or ad valorem tax
- Show the supply curve shift (left/upward)
- Identify the new equilibrium price and quantity
- Discuss who bears the tax burden (considering elasticity)
- Consider any welfare effects (consumer surplus, producer surplus, deadweight loss)
Subsidies
A subsidy is a grant given by the government to producers to encourage production of a good or service. Subsidies have been particularly common in agriculture, which governments often view as having strategic significance.
Analytically, a subsidy acts like a negative indirect tax, shifting the supply curve in the opposite direction.
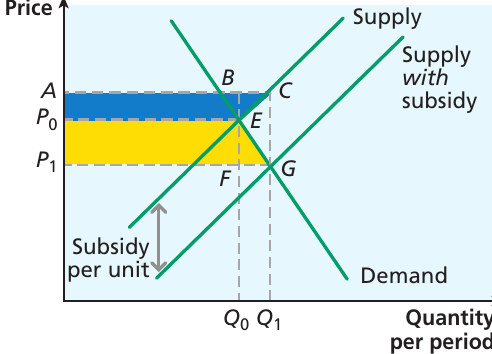
The diagram illustrates subsidy effects:
- Original equilibrium at price and quantity
- Subsidy shifts supply curve right/downward to "supply with subsidy"
- New equilibrium at lower price and higher quantity
Key features to note:
- Consumer benefit (): Consumers gain from lower prices, increasing consumer surplus
- Producer benefit (): Producers receive higher effective prices ( plus subsidy)
- Government cost (): The total subsidy payment (subsidy per unit × quantity)
- Area CGE: Deadweight loss that cannot be recovered
The subsidy benefits are shared between buyers (through lower prices) and sellers (through higher net receipts), with the distribution depending on the elasticity of demand. Consumers gain the most when demand is elastic; producers gain more when demand is inelastic.
If the government's aim is to increase production, the subsidy achieves this only partially. Success also depends on demand elasticity. The more elastic demand is, the greater the quantity increase.
Study tip: Remember that when analyzing indirect taxes or subsidies in exams, the effect is always to shift the supply curve. For a tax, shift left/upward; for a subsidy, shift right/downward. Never shift the demand curve for these interventions.
Do consumers always act rationally?
Economic theory traditionally assumes consumers act rationally to maximize their utility. However, recent research in experimental and behavioral economics suggests this assumption doesn't always hold. Consumers sometimes make decisions that appear economically irrational.
Economically irrational behaviours
Several patterns of behavior challenge the rational consumer model:
Habitual behaviour
Habitual behaviour occurs when consumers persist in acting in a particular way even when conditions have changed. This persistence may be costly but continues because habits are difficult to break.
Example: Gym Membership and Inertia
Someone might join a gym with good intentions of getting fit but then find they're too busy to attend. However, they continue paying the monthly subscription through inertia, or because they maintain good intentions even without acting on them.
Similarly, people may not bother switching bank accounts or energy suppliers even when cheaper options exist, simply because changing requires effort.
This type of behavior is particularly relevant for products that are addictive. Tobacco provides an extreme example where habit creates persistence even though continued use is costly and harmful.
Herding
Herding occurs when people make decisions based on others' actions rather than through rational evaluation of their situation. Consumers may purchase goods that are popular or that their friends recommend, even if these choices don't actually suit their needs or preferences.
Fashion trends and popular products often spread through herding behavior, as people want to buy what others are buying rather than independently assessing product merits.
Impulse buying
People sometimes make purchases on impulse rather than through careful consideration. Supermarkets exploit this by placing tempting items near checkouts where waiting customers can see them. The checkout chocolate bar purchase represents a classic example of impulse buying.
Social responsibility and altruism
People occasionally make decisions based on social responsibility concerns. For example, you might avoid buying goods involving unrecyclable plastic to help conserve the environment, even though this choice is costly. Such behavior is seen as socially responsible but involves accepting extra cost.
Charitable giving represents another example where people behave altruistically, incurring costs to help others without expecting direct personal benefit.
Computational weakness
Complex decisions involving calculations that people don't understand or cannot compute may lead to poor choices. When faced with complicated financial products or insurance policies, consumers may struggle to evaluate options rationally, leading to economically suboptimal decisions.
Bounded rationality
In many cases, seemingly irrational behavior reflects information problems. There may be too much information for consumers to absorb and process effectively. Information about products may be difficult to gather or analyze. People then make decisions based on the best information they can find and the most accessible information they can analyze.
This is sometimes called bounded rationality - where economic agents do the best they can given the information available. Consumers aren't necessarily acting irrationally; they're simply working within information constraints.
Exam tip: When discussing consumer behavior in exams, don't simply assert that behavior is irrational. Consider whether information problems, bounded rationality, or other constraints might explain the behavior. This demonstrates more sophisticated economic understanding.
Nudge theory
Firms and governments have become aware of these behavioral patterns and sometimes exploit them. Nudge theory suggests that people's choices can be influenced by making desirable decisions easy to make.
Applications of nudge theory
Examples of nudge theory in practice include:
Motorway service stations: Signs encouraging drivers to take litter home by suggesting "others do" or reminding them "there is no 'away'" help promote responsible behavior by appealing to people's sense of social norms.
COVID-19 pandemic: The UK government used nudge theory extensively to persuade people to follow lockdown rules and get vaccinated. Messaging emphasized protecting others and the NHS, making compliance seem like the socially responsible choice that most people were making.
Pension schemes: Legislation now requires employers to automatically enrol employees in workplace pension schemes unless workers actively opt out. Research shows people are much more likely to remain enrolled (taking the default option) than to opt in if they need to take active steps. This "nudges" people toward saving for retirement.
Robert Thaler received the Nobel Prize for Economic Sciences in 2017 for his work on nudge theory and behavioral economics, recognizing the importance of understanding how people actually make decisions rather than assuming perfect rationality.
Case Study: Auto-Enrolment Pension Schemes
Auto-enrolment pension schemes in the UK demonstrate nudge theory's power. Before auto-enrolment, many workers didn't participate in workplace pensions even when employers offered matching contributions.
After auto-enrolment became law, participation rates increased dramatically, as people accepted the default option rather than actively opting out. This shows how making the desirable choice the easiest choice significantly influences behavior.
Remember!
Key Points to Remember:
-
Agricultural markets experience supply volatility due to unpredictable weather and climate conditions, creating price fluctuations that are difficult to forecast.
-
Commodity markets often show demand volatility linked to business cycles. The bauxite and oil markets demonstrate how commodity prices fluctuate with economic conditions and supply disruptions.
-
Housing markets are influenced by interest rates (affecting demand through borrowing costs) and slow supply expansion (due to construction time and regulations). This combination can produce rapid price increases.
-
Foreign exchange markets determine currency exchange rates through supply and demand. Exchange rates represent derived demand, as people want currency to buy goods, services, or assets.
-
Indirect taxes shift the supply curve left/upward. The incidence of taxation (who bears the burden) depends on elasticity of demand. Specific taxes are fixed per unit; ad valorem taxes are a percentage of price.
-
Subsidies shift the supply curve right/downward, reducing prices and increasing quantity traded. Benefits are shared between buyers and sellers depending on demand elasticity.
-
Consumer behavior doesn't always follow the rational utility-maximization model. Habitual behavior, herding, impulse buying, and computational weakness lead to economically irrational decisions.
-
Nudge theory recognizes that consumer choices can be influenced by making desirable options easy to choose, such as through default options in pension schemes or social messaging during the pandemic.