Market Equilibrium (Edexcel A-Level Economics A): Revision Notes
Market Equilibrium
Introduction
When we bring together demand and supply in a market, something remarkable happens. The interaction between consumers wanting to buy goods and firms wanting to sell them creates a natural balance point. This balance point is called market equilibrium, and understanding it is crucial for analysing how markets function in the real world.
Market equilibrium helps us understand how prices are determined and how resources are allocated in an economy. It also allows us to predict what will happen when market conditions change, such as when consumer tastes shift or production costs increase.
Understanding market equilibrium is one of the most powerful tools in economics. It allows you to analyse and predict market outcomes across all types of goods and services, from everyday items like bread and milk to complex markets like housing and financial assets.
What is market equilibrium?
Market equilibrium occurs when the price in a market settles at a level where the quantity that consumers wish to buy exactly matches the quantity that firms wish to sell. At this point, there is no pressure for the price to change, and the market is said to "clear".
Think of it like a perfectly balanced scale. On one side, we have consumers with their demand, and on the other side, we have producers with their supply. When these two forces are in balance, we have found the equilibrium.
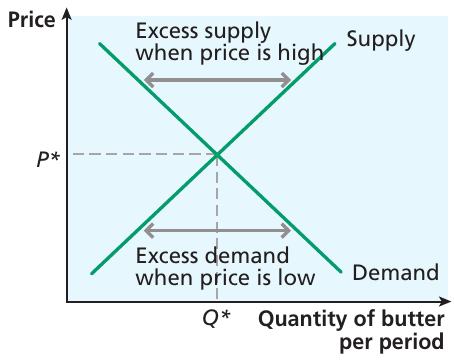
The diagram above shows how demand and supply curves come together. The point where they intersect (marked as P* and Q*) represents the equilibrium price and equilibrium quantity. At this price:
- Consumers are willing and able to buy exactly Q* units
- Firms are willing and able to supply exactly Q* units
- There is no shortage and no surplus
At market equilibrium, the market "clears" - this means every consumer who wants to buy at the equilibrium price can do so, and every firm that wants to sell at that price can do so. There are no frustrated buyers or sellers left in the market.
Understanding disequilibrium
Markets don't always operate at equilibrium. Sometimes prices are set at levels that create imbalances. There are two types of disequilibrium situations you need to understand:
Excess supply
Excess supply occurs when the quantity that firms want to supply is greater than the quantity consumers want to demand at the current price. This happens when the price is set too high.
Worked Example: Excess Supply of Butter
Imagine butter is priced above its equilibrium level. At this high price:
- Firms want to supply lots of butter (they can make good profits)
- Consumers don't want to buy much butter (it's too expensive)
- Butter stocks build up in warehouses
- The value of butter sitting unsold may exceed what consumers think it's worth
What happens next? Firms realise they need to reduce their prices to clear their stocks. As the price falls, there is:
- Movement down the supply curve (firms supply less)
- Movement up the demand curve (consumers buy more)
This process continues until excess supply is eliminated and equilibrium is reached.
The key insight is that excess supply creates downward pressure on price. Firms with unsold inventory have an incentive to lower prices to attract more customers, and this automatic adjustment pushes the market back towards equilibrium.
Excess demand
Excess demand occurs when the quantity consumers want to buy exceeds the quantity firms want to supply at the current price. This happens when the price is set too low.
Worked Example: Excess Demand for Butter
Using the butter example again, if the price is below equilibrium:
- Consumers want to buy lots of butter (it's a bargain)
- Firms don't want to supply much butter (they can't make enough profit)
- Shortages appear in shops
- Some consumers may be willing to pay more than the going price to obtain butter
The market adjusts through price increases. Some consumers might offer to pay more to secure their butter supplies, and firms realise they can raise prices. As price rises:
- Movement up the supply curve (firms supply more)
- Movement down the demand curve (consumers demand less)
This adjustment continues until the excess demand is eliminated.
Excess demand creates upward pressure on price. When goods are scarce and consumers are competing for limited supplies, firms can raise prices. This happens automatically in free markets without anyone needing to plan or coordinate the adjustment.
How free markets reach equilibrium
In a free market, natural forces encourage prices to move towards equilibrium. This happens through the price mechanism, which acts as a signalling system:
- When there is excess supply, falling prices signal to firms to produce less and to consumers to buy more
- When there is excess demand, rising prices signal to firms to produce more and to consumers to buy less
The market converges on the equilibrium price (P*) and equilibrium quantity (Q*) through movements along both the demand and supply curves. At equilibrium, the decisions of consumers and firms are mutually consistent - everyone can buy or sell the amount they want at the prevailing price.
The beauty of the price mechanism is that it coordinates the decisions of millions of consumers and producers without central planning. Prices act as signals that guide resources to where they are most valued, achieving market equilibrium through the independent actions of market participants.
Changes to market equilibrium
Equilibrium is not a fixed point forever. When market conditions change, the equilibrium itself shifts to a new position. This happens when either the demand curve or the supply curve moves. Let's explore this using the market for dried pasta as an example.
The initial equilibrium for dried pasta
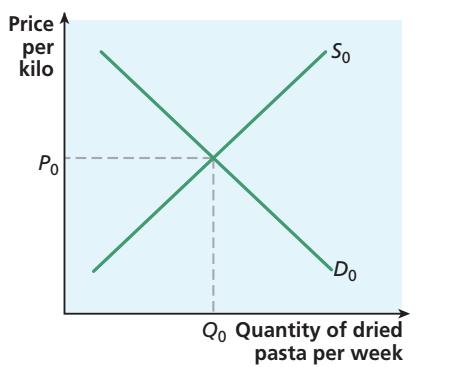

The diagram shows the dried pasta market in its initial equilibrium position. The demand curve D₀ and supply curve S₀ intersect at price P₀ and quantity Q₀. This represents the "before" position, which we can now disturb to see what happens.
A change in consumer preferences
Suppose a study is published highlighting the health benefits of eating pasta, backed up by an advertising campaign. This change in consumer preferences increases the demand for pasta at any given price.
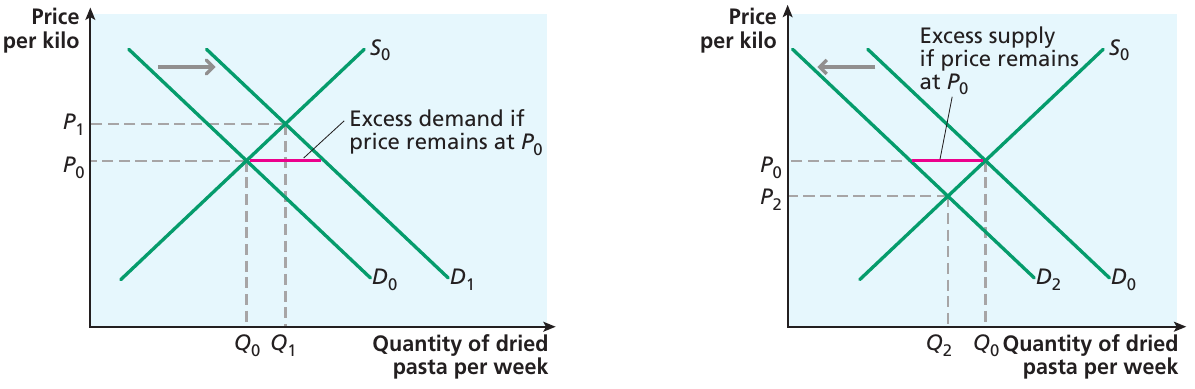
Worked Example: Increase in Demand for Pasta
The left panel shows what happens when demand increases:
- The demand curve shifts to the right (from D₀ to D₁)
- At the original price P₀, there is now excess demand
- Consumers want to buy more pasta than firms are supplying
- The price is bid up as consumers compete for limited supplies
- The market moves to a new equilibrium at price P₁ and quantity Q₁
- Both price and quantity have increased
Notice that the supply curve hasn't moved. Instead, there has been an extension of supply - firms move up along their existing supply curve, willing to supply more at the higher price.
Worked Example: Decrease in Demand for Pasta
The right panel shows the opposite scenario - a decrease in demand:
- The demand curve shifts to the left (from D₀ to D₂)
- At the original price P₀, there is now excess supply
- Firms want to sell more than consumers want to buy
- The price falls to clear the excess stock
- The market reaches a new equilibrium at price P₂ and quantity Q₂
- Both price and quantity have decreased
A change in the price of a substitute
Substitutes are goods that can be used in place of each other. For dried pasta, fresh pasta is a close substitute.
If the price of fresh pasta falls, some consumers will switch from dried pasta to fresh pasta. This causes:
- The demand curve for dried pasta to shift left
- Excess supply at the original price
- A fall in both equilibrium price and quantity for dried pasta
- A contraction of supply as firms move down their supply curve
This demonstrates an important principle: a change in the price of a substitute good causes the demand curve to shift. This is different from a change in the price of the good itself, which causes movement along the demand curve.
An improvement in production technology
Now let's consider what happens when there's a change affecting supply rather than demand. Suppose a new pasta-making machine is invented that allows dried pasta makers to produce at lower cost than before.
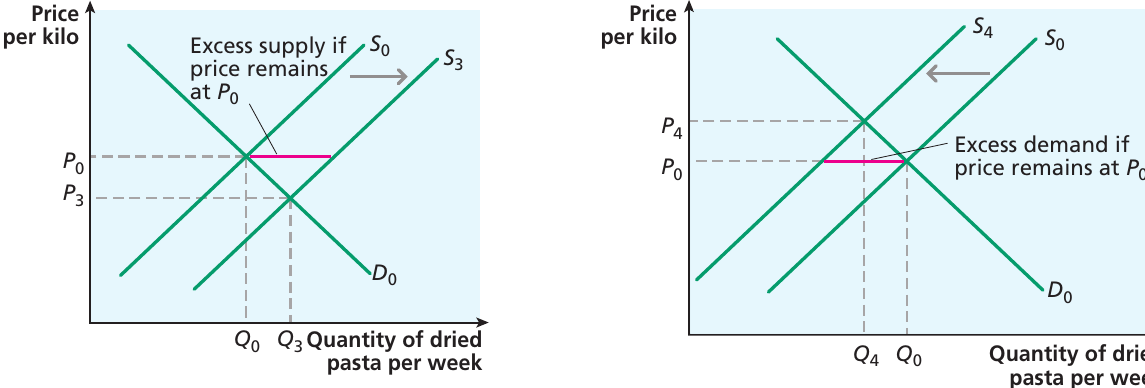
Worked Example: Increase in Supply (Lower Production Costs)
The left panel shows this scenario:
- Lower production costs mean firms are willing to supply more at any given price
- The supply curve shifts to the right (from S₀ to S₃)
- At the original price P₀, there is now excess supply
- The price falls as firms compete to sell their increased output
- The market settles at a new equilibrium with price P₃ and quantity Q₃
- Price has decreased, but quantity has increased
Notice that the demand curve hasn't shifted. Instead, there has been an extension of demand - consumers move down along their demand curve, buying more at the lower price.
An increase in labour costs
Finally, consider what happens if production costs increase. Perhaps pasta workers negotiate higher wages, or stricter health and safety regulations raise production costs.
Worked Example: Decrease in Supply (Higher Production Costs)
The right panel shows this effect:
- Higher costs mean firms are willing to supply less at any given price
- The supply curve shifts to the left (from S₀ to S₄)
- At the original price P₀, there is now excess demand
- The price rises as consumers compete for the reduced supply
- The new equilibrium is at price P₄ and quantity Q₄
- Price has increased, but quantity has decreased
Analysing equilibrium changes: a systematic approach
When you need to analyse how equilibrium changes, follow these steps:
Systematic Approach to Analysing Market Changes:
-
Identify the initial equilibrium - note the starting price and quantity where supply and demand intersect
-
Determine which curve shifts - does the change affect demand (consumer-side factors) or supply (producer-side factors)?
-
Determine the direction of the shift - does the curve shift right (increase) or left (decrease)?
-
Identify the disequilibrium created - at the original price, is there now excess supply or excess demand?
-
Predict the new equilibrium - how must price and quantity change to eliminate the disequilibrium?
Worked Example: UK Sunflower Oil Shortage (2022)
The UK experienced a shortage of sunflower oil in early 2022 because much of the product was normally imported from Ukraine, but supplies were interrupted by conflict.
Analysis:
- This is a supply-side shock that shifts the supply curve left
- Creates excess demand at the original price
- The market adjusts through higher prices and lower quantities traded
Key principles to remember
For demand shifts:
- An increase in demand (rightward shift) leads to higher equilibrium price and higher equilibrium quantity
- A decrease in demand (leftward shift) leads to lower equilibrium price and lower equilibrium quantity
- The supply curve stays in place, but there is movement along it (extension or contraction)
For supply shifts:
- An increase in supply (rightward shift) leads to lower equilibrium price and higher equilibrium quantity
- A decrease in supply (leftward shift) leads to higher equilibrium price and lower equilibrium quantity
- The demand curve stays in place, but there is movement along it (extension or contraction)
The size of the effect matters:
- Larger shifts in demand or supply curves create larger changes in equilibrium price and quantity
- The slopes of the curves also affect how much price versus quantity changes
Practical applications
Understanding market equilibrium helps you make sense of real-world events:
- Why do strawberry prices fall in summer? (Supply increases as more farms harvest)
- Why do hotel prices rise during school holidays? (Demand increases)
- Why did hand sanitiser prices spike during the COVID-19 pandemic? (Supply disruption and demand increase)
- Why do new technologies often start expensive then become cheaper? (Supply increases as production scales up)
Practice Tip: Try analysing news stories about markets by drawing demand and supply diagrams. Identify whether events affect demand or supply, predict the direction of change, and check whether real-world outcomes match your predictions. This active practice will strengthen your understanding of market equilibrium.
Remember!
Key Points to Remember:
-
Market equilibrium occurs where supply equals demand - at this point, the quantity consumers want to buy exactly matches the quantity firms want to sell, with no pressure for price to change
-
Disequilibrium creates automatic adjustment forces - excess supply causes prices to fall, while excess demand causes prices to rise, naturally pushing the market back towards equilibrium
-
Shifts in demand move the equilibrium along the supply curve - increased demand leads to higher prices and quantities, while decreased demand leads to lower prices and quantities
-
Shifts in supply move the equilibrium along the demand curve - increased supply leads to lower prices but higher quantities, while decreased supply leads to higher prices but lower quantities
-
The price mechanism coordinates market activity - in free markets, prices act as signals that guide resources to where they are most valued, achieving equilibrium without central planning