Economic Growth (Edexcel A-Level Economics A): Revision Notes
Economic Growth
Introduction to macroeconomics and economic performance
Economics can be divided into two main branches. Up to this point, we have focused on microeconomics, which examines individual markets and how they function. Now we turn our attention to macroeconomics, which takes a broader view of the economy as a whole.
Macroeconomics is the study of how economic variables interact at an aggregate (whole economy) level, rather than looking at individual markets. In a modern economy, there are thousands of separate markets, making it difficult to get a complete picture of economic performance by examining them individually. Instead, macroeconomists focus on aggregate measures that show totals across the economy.
Several key indicators are used to monitor economic performance:
- Economic growth – the change in the total output of the economy over time
- Inflation – the rate at which the general price level is rising
- Unemployment – the extent to which the economy is using its labour resources efficiently
- Balance of payments – how the economy interacts with the rest of the world through trade
Of these indicators, economic growth is arguably the most fundamental. After all, the basic economic problem involves allocating scarce resources to meet unlimited wants. Economic growth helps address this problem by expanding the resources available to society over time, thereby increasing people's choices and improving living standards.
The importance of data
To assess how well an economy is performing, we need reliable information about what is happening. This requires careful observation and measurement, which is where economic data becomes essential.
Economics, particularly macroeconomics, is a non-experimental discipline. Unlike scientists who can conduct controlled laboratory experiments, economists cannot run experiments on entire economies to test their theories. Instead, they must observe real-world economic activity and gather data about various changes occurring in the economy. Economists then use this evidence to evaluate whether their theories about how the economy works are supported by what actually happens.
For each of the key economic variables mentioned above, we need a reliable measure that allows us to track changes over time. This enables us to observe how the economy is evolving and to make informed judgements about its performance.
Sources of economic data
Most economic statistics used by economists are collected and published by government agencies. In the UK, the primary source is the Office for National Statistics (ONS). Data for other countries come from sources such as:
- The International Monetary Fund (IMF)
- The World Bank
- The United Nations
- National statistical agencies in each country
There is little alternative to relying on these official sources because collecting accurate economic data is expensive and time-consuming. The ONS, IMF, World Bank, and UN are the most reliable sources for economic data analysis.
Interpreting data with caution
When working with economic data, several important points must be kept in mind:
Understanding data compilation: It is important to know how data are compiled and what they are intended to measure. This helps in interpreting the figures correctly.
The ceteris paribus limitation: Economic analysis often relies on the assumption of 'ceteris paribus' (other things remaining equal). However, in the real world, many things change simultaneously, so we cannot always attribute economic outcomes to single causes.
Even data from reputable sources like the ONS cannot be treated as absolutely certain. Some economic data take considerable time to compile, so early estimates are provisional and subject to later revision as more information becomes available. This means initial figures may change significantly once complete data becomes available.
International comparisons: Data used for comparing different countries must be treated with even greater caution, as collection methods and definitions may vary between nations.
While you do not need to memorize detailed statistics about the UK economy, it is helpful to be familiar with recent events and general trends in economic performance.
Real and nominal measurements
One fundamental challenge in measuring economic variables is deciding what units of measurement to use. Consider the problem of measuring total output produced in an economy during a year. We cannot simply count physical units because the economy produces many different items – computers, cars, tins of paint, cauliflowers – and these cannot be meaningfully added together.

The obvious solution is to use money values. By applying prices to each item, we can calculate the monetary value of all goods produced and obtain a measurement of total output in pounds sterling. However, this creates a new problem: when monitoring changes in total output between two years, both the volumes of goods produced and their prices may change. If we use pounds sterling as our unit of measurement, the measure will change from one year to the next as prices change.
This is a problem unique to economics and other social sciences. In physics, for example, the length of a metre does not alter from one year to the next, so measurements remain comparable over time. Economists, however, must account for changing prices when measuring variables in monetary terms.
Nominal and real values
When GDP is measured using current prices, the result is a value measure known as nominal GDP. This shows the money value of total output at the prices that prevailed when the output was produced. However, when prices are rising over time, nominal GDP will overstate the extent to which the volume of output is growing.
Nominal GDP is the value of GDP based on current prices, taking no account of changing prices through time.
Real GDP is an estimate of the volume of GDP calculated by accounting for changing prices through time.
To remove the effect of changing prices, we can produce an estimate of the underlying volume of GDP, known as real GDP. A similar distinction between nominal and real values applies to other macroeconomic variables observed over time.
Worked Example: The Ice Cream Illustration
Suppose last year you bought a tub of ice cream for $3. This year, with inflation at 10%, you had to pay $3.30 for the same tub.
Analysis:
- Your volume of consumption has not changed – you still bought one tub of ice cream
- Your spending has increased in nominal terms from $3 to $3.30
If you were to measure changes in your consumption using monetary values alone, it would appear that your spending increased by 10%. This would be misleading because your real consumption (the actual quantity consumed) remained constant at one tub. The increase in spending was entirely due to the price rise, not an increase in consumption.
Converting nominal values to real values
One way to obtain real measures is to take the quantities produced in a reference year (known as the base year) and value these at the prices that prevailed in that base year. The base year prices are then used to value quantities observed in later years. This focuses on 'real' values, unaffected by any changes in prices, as everything is measured at constant prices.
The ratio of the current (nominal) value of a variable to its constant price (real) value, multiplied by 100, is a price index. This can be expressed as:
Worked Example: Calculating Real GDP
In 2021, GDP for the UK at current prices was estimated to be $2,317.6 billion, and the underlying price index was 105.55 (based on 2019 = 100).
Calculation:
This shows that when we account for price changes, the real value of GDP is lower than the nominal value.
Calculating percentage changes
In macroeconomics, it is often important to calculate the percentage change in a variable. For example, we may want to know how rapidly prices are changing, or to calculate the rate of economic growth.
The general formula for calculating percentage change is:
Note that the change in the variable is always expressed as a percentage of the old value, not the new value. This is a common mistake to avoid.
Worked Example: Calculating Percentage Change
Using the ice cream example from earlier: the price increased from $3 to $3.30.
Calculation:
This confirms that the price increased by 10%.
Index numbers
Sometimes there is no meaningful unit of measurement available for a variable. For example, if you wanted to measure the general level of prices in an economy, there is no obvious unit that could be used. In such cases, the solution is to use index numbers.
Index numbers are a device for comparing the value of a variable in one period or location with a base observation. They show the value relative to a base period.
Creating an index number
Suppose the price of a 250g pack of butter was $1.20 last year and $1.80 this year. To compare these prices, we can calculate the percentage change using the formula introduced earlier:
Alternatively, we can calculate an index number. This involves taking the current value divided by the base value, multiplied by 100:
Worked Example: Creating an Index Number
Using the butter price example:
This gives us an index number of 150, showing the current value relative to the base value.
This turns out to be a useful way of expressing a range of economic variables where you want to show values relative to a base period. Index numbers can be used to compare different regions or to compare variables measured in different units – anything where you want to compare values against some base level.
Key Points: Measurement Issues
- Macroeconomics studies interrelationships between economic variables at the aggregate level
- Key variables of interest include inflation, unemployment, and economic growth
- Economists cannot conduct experiments, so they rely on economic data gathered from observations
- Data measured in money terms must be handled carefully because prices change over time
- The distinction between nominal (current prices) and real (constant prices) values is essential
- Index numbers are helpful for comparing values over time when there is no meaningful unit of measurement
Economic growth
If the ultimate aim of a society is to improve the well-being of its citizens, then the resources available within the economy need to expand over time to widen people's choices. This expansion of resources requires a process of economic growth.
Potential economic growth
From a theoretical perspective, potential economic growth can be understood as an expansion of the productive capacity of an economy. In other words, it is an expansion of the potential output of the economy.
Potential economic growth is an expansion in the productive capacity of the economy.
The production possibility frontier (PPF), introduced in microeconomics, provides a useful way to visualize this concept. Potential economic growth is characterized by an outward movement of the production possibility frontier from PPF₁ to PPF₂. This outward shift means the economy can produce more goods and services in any given period as a result of an expansion in its resources.
Measuring economic output: GDP and GNI
Gross domestic product (GDP) represents the total output of an economy during a period of time. It measures the total value of economic activity carried out in the domestic economy.
Gross domestic product (GDP) is a measure of the economic activity carried out in the domestic economy over a period.
GDP can be calculated in three equivalent ways:
- The total value added produced by firms in the domestic economy during a period
- The total expenditures on goods and services in the period
- The total amount of income earned in the domestic economy
In principle, these three approaches should give the same answer, but in practice GDP is calculated as the average of the three measures.
GDP versus GNI
GDP focuses on the domestic economy, measuring economic activity that takes place within a country's borders. However, residents of an economy also receive some income from abroad, and some income earned in the domestic economy is sent abroad.
Gross national income (GNI) takes into account these income flows between countries. It is calculated as GDP plus net income from abroad.
Gross national income (GNI) is GDP plus net income from abroad.
GNI was formerly known as gross national product (GNP). This measure is the standard used by the World Bank to compare average incomes across countries, making it useful for international comparisons.
Actual economic growth
Actual economic growth is measured by the percentage rate of growth of real GDP (or GNI) in a period. This differs from potential economic growth because the economy does not always operate at full capacity.
Actual economic growth is the rate of growth of real GDP in a period.
Economies tend to go through a trade (business) cycle, with the level of economic activity fluctuating around an underlying trend. During some periods, the economy may be operating below its potential capacity, while at other times it may be above it.
Trade (business) cycle is a phenomenon whereby GDP fluctuates around its underlying trend, following a regular pattern.
When an economy is operating at full potential (on the PPF), it is at capacity. A movement towards the PPF from below would represent actual economic growth (but not potential economic growth). This is a crucial distinction – actual growth is about using existing capacity more fully, while potential growth is about expanding that capacity.
UK economic growth trends
The following figure shows real GDP in the UK from 1980 to 2021, measured at constant 2019 prices. You can see that during this period, real GDP grew almost every year, though there were some years where it dipped.
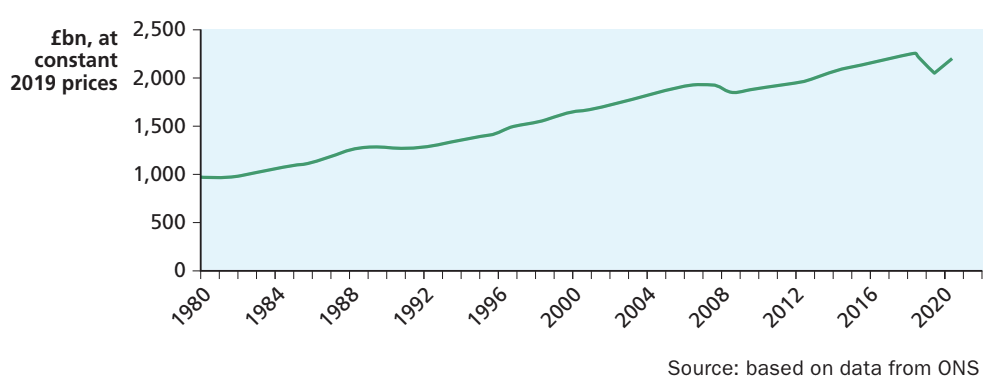
This figure shows the level of real GDP. To understand growth, we need to examine the annual rate of change. The next figure shows the annual growth rate of real GDP in the UK since 1980.
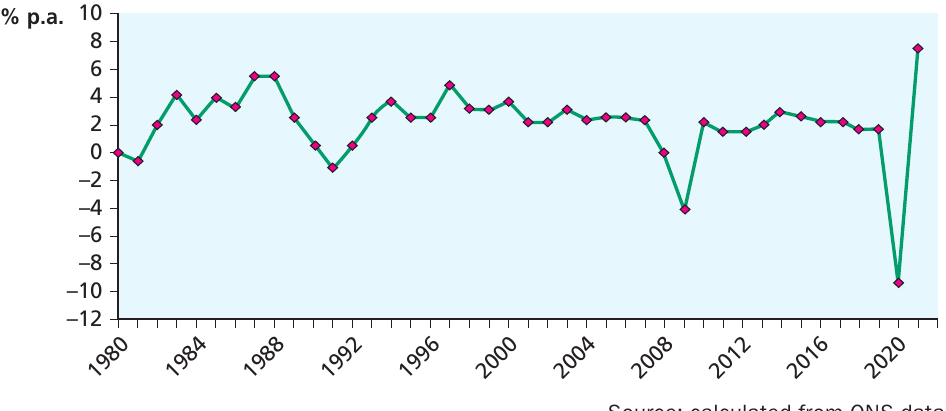
This graph reveals several important features:
Volatility: It is quite difficult to determine the underlying trend because year-to-year movements are volatile. Growth rates fluctuate significantly from one year to the next, demonstrating the business cycle in action.
Recessions: Notice how real GDP fell after 2007 before rising again, reflecting the impact of the global financial crisis. The economy experienced a significant recession during this period.
COVID-19 impact: The dramatic impact of the coronavirus (COVID-19) pandemic is evident in 2020, when real GDP fell sharply to around -9.5%. However, this was partially cushioned by the furlough scheme introduced by the government. By 2021, there was a sharp recovery to around +7.5%, creating a distinctive V-shaped pattern.
Long-term growth trends
To better understand long-term patterns, we can examine average growth rates over longer periods. The following figure shows 5-yearly average growth rates since 1950, with a horizontal dashed line indicating the overall trend.
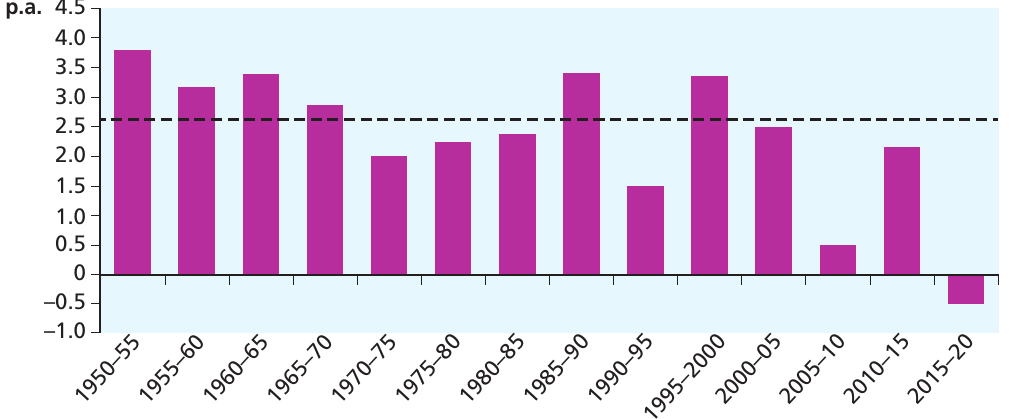
This longer-term view reveals:
Declining trend: Average growth rates have generally declined over the decades. Growth was highest in the 1950s and 1960s (around 3-4% per annum) and has been lower in recent decades.
Below-trend growth: The most recent period (2015-20) shows negative average growth, largely due to the COVID-19 pandemic impact in 2020.
Trend rate: The dashed line at approximately 2.6% p.a. represents the underlying trend rate of growth over this long period.
Understanding the data
The table below shows real GDP data for the UK from 2010 to 2021:
| Year | Real GDP (£bn) |
|---|---|
| 2010 | 1,885 |
| 2011 | 1,912 |
| 2012 | 1,940 |
| 2013 | 1,977 |
| 2014 | 2,036 |
| 2015 | 2,089 |
| 2016 | 2,137 |
| 2017 | 2,182 |
| 2018 | 2,218 |
| 2019 | 2,255 |
| 2020 | 2,043 |
| 2021 | 2,196 |
This data shows consistent upward growth from 2010 through 2019, with a notable decline in 2020 due to COVID-19, followed by partial recovery in 2021.
Interpreting graphs and data
When analyzing economic data, different types of graphs serve different purposes:
Line graphs are useful for tracing patterns in data over time. They help us identify upward or downward trends and periods when the data series moves up or down. Time is typically shown on the horizontal axis, with data values on the vertical axis.
Column (bar) graphs are helpful when comparing average values across different periods. They allow easy visual comparison of the relative heights of columns.
Bar graphs are useful for comparing data across countries at a single point in time.
Seasonal adjustment
GDP data are provided on a quarterly basis (four times per year). Like many macroeconomic variables, real GDP tends to fluctuate with the seasons. For example, GDP tends to be higher in the Christmas quarter (October to December) but then falls in the following period.
These regular seasonal fluctuations can distract from the overall pattern across time. To address this, a process of seasonal adjustment is undertaken, smoothing out these regular fluctuations to reveal the underlying trend.
Seasonal adjustment is a process by which seasonal fluctuations in a variable are smoothed to reveal the underlying trend.
Quarterly data from 2012 to 2022 would show both a seasonally adjusted series and a non-seasonally adjusted series. The seasonally adjusted series focuses on the underlying trend by removing the distractions of seasonal variations. The impact of the COVID-19 pandemic is even more apparent in quarterly data, showing that by the end of 2022, real GDP was still below the pre-pandemic level.
Key Points: Economic Growth
- Economic growth is a fundamental aspect of economic performance, as it enables citizens of a country to become better off
- Potential economic growth is an increase in the productive capacity of an economy – an increase in potential output
- GDP measures total economic activity in an economy by residents living in the country
- The rate of growth of real GDP informs us about actual economic growth (the increase in output), but not necessarily about potential output growth, which is more difficult to measure
- Economies tend to fluctuate around their underlying trend, creating a business cycle
- The UK experienced significant disruption due to the 2008 financial crisis and the 2020 COVID-19 pandemic
Remember!
Essential Takeaways
-
Macroeconomics focuses on aggregate variables that measure the performance of the whole economy, such as total output (GDP), inflation, unemployment, and the balance of payments.
-
Real values are essential for meaningful comparisons over time. Always distinguish between nominal values (at current prices) and real values (adjusted for inflation) when analyzing economic data.
-
Economic growth has two dimensions: potential growth (expansion of productive capacity) and actual growth (measured by the percentage change in real GDP), which fluctuates around the trend due to the business cycle.
-
GDP and GNI measure different things: GDP measures domestic economic activity, while GNI includes net income flows from abroad, making it useful for international income comparisons.
-
Data interpretation requires caution: Economic data are subject to revision, influenced by seasonal factors, and cannot establish single causes due to the complexity of real-world changes occurring simultaneously.