Chi Squared Tests for Standard Distributions (Edexcel A-Level Further Mathematics): Revision Notes
21.2.3 Chi Squared Tests for Standard Distributions
Least Squares Regression Line
When we have evidence (after visually inspecting data and calculations of ) that a data set is linearly correlated, it makes sense to draw a line of best fit. This is called the "Least Squares Regression Line."
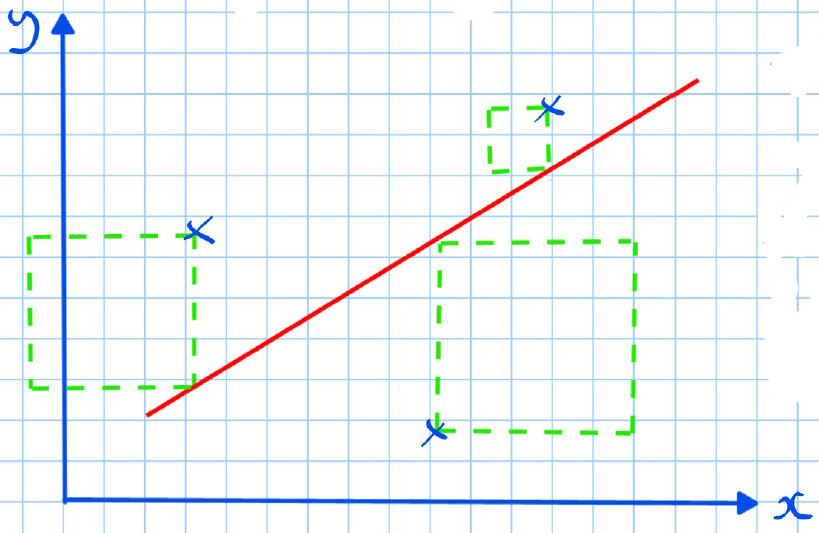
The process of calculating the regression line involves minimising the squares of the vertical distances from the points to the line.
The least squares regression x-line is the line for which the total area of the squares is least.
Worked Example
Example Given that the following data is known to be linearly correlated, calculate the regression line of y on :
| Age of tree (years) | 7 | 24 | 12 | 19 |
|---|---|---|---|---|
| Height of tree (m) | 2.4 | 6 | 5 | 5.8 |
Step 1: on means " depends on ." Decide which variable depends on the other and assign these to be and , respectively.
The reason for this is that there is an assumption that any variability (deviation from the line of best fit) only occurs for the dependent variable.
Step 2: Assigning the relevant variables to be and , we use the least squares regression line formula given in the booklet:
The regression coefficient of on is:
Least squares regression line of on is:
Summing up the values:
Now:
So:
Now for :
Thus the equation of the regression line is:
Least Squares Regression Line on a Calculator:
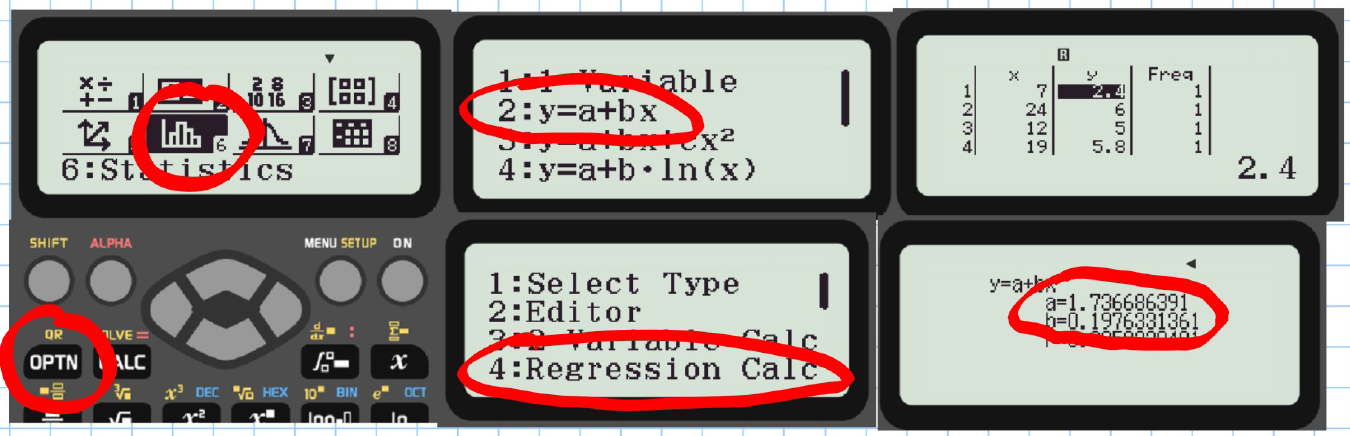
Unless required to show full working, do this.
Notable Points
- The least squares regression line is only a reliable predictor if:
- We have evidence that the data is linearly correlated.
- We use it to predict values inside the range of the data we already have (predicting values outside of this range is unreliable and called extrapolation).
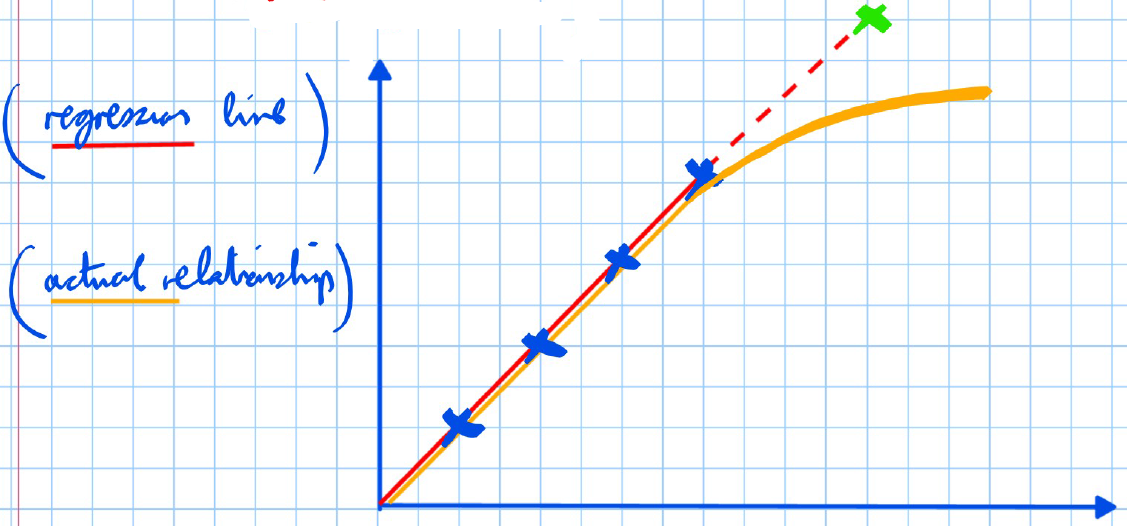
If we extrapolate this data for values beyond the range, we obtain .
However, if the actual relationship was
then the regression line is not an appropriate predictor. This is because we cannot be sure the linear relationship holds beyond the data we have.
- When unclear or uncertain which variable depends on which, should be the control variable! E.g., if you choose to take measurements of the heights of trees every years, you are controlling time, so this should be .
Example: Research was done to see if there is a relationship between finger dexterity and the ability to do work on a production line. The data is shown in the table.
| Dexterity score, | 2.5 | 3 | 3.5 | 4 | 5 | 5 | 5.5 | 6.5 | 7 | 8 |
|---|---|---|---|---|---|---|---|---|---|---|
| Productivity, | 80 | 130 | 100 | 220 | 190 | 210 | 270 | 290 | 350 | 400 |
The equation of the regression line for these data is .
a. Use the equation to estimate the productivity of someone with a dexterity of .
b. Give an interpretation of the value of in the equation of the regression line.
c. State, giving in each case a reason, whether or not it would be reasonable to use this equation to work out the productivity of someone with dexterity of:
i) 2 ii) 14
Answers:
a. Let x = 6
b. As the dexterity increases by , the productivity increases by . (Give answer in context.)
c. i) Reasonable as it is close to the range of data we have.
ii) Unreasonable as it is well outside of the range of data we have. (Extrapolation is unreliable.)