Chi Squared Tests for Contingency Tables (Edexcel A-Level Further Mathematics): Revision Notes
21.2.4 Chi Squared Tests for Contingency Tables
Testing for Statistical Independence
Two events, and, are statistically independent if the fact that one occurs, the probability of the other occurring is not affected.
An example of two events that are statistically dependent is the situation in which there are red tokens in a bag and blue. If is the event of choosing a red token and the event of choosing a blue, if two tokens are chosen (without replacement), then the probability of the second depends on the outcome of the first.
Mathematical Definition of Independence
Events and are independent if:
In the above example:
Thus, and are not independent.
Chi-Squared Test for Statistical Independence
If we are given a two-way table of data outlining the overlapping occurrence of events, we can use this data to test whether the two events are dependent or independent from one another.
Example: Test at the 5% significance level whether the number of bedrooms in a home and the number of children in the home are statistically independent.
| Number of Bedrooms | 0 Children | 1 Child | 2 Children | 3 or More Children | Total |
|---|---|---|---|---|---|
| 2 or fewer | 12 | 18 | 6 | 4 | 40 |
| 3 | 22 | 18 | 0 | 0 | 40 |
| 4 or more | 2 | 16 | 19 | 3 | 40 |
| Total | 36 | 52 | 25 | 7 | 120 |
Step 1: State the null and alternate hypotheses, assuming independence as the null hypothesis:
: Number of bedrooms and number of children are statistically independent
: Number of bedrooms and number of children are not statistically independent
Step 2: Based on the assumption that the events are independent, calculate from the totals the expected frequencies.
Step 3: This method leads to large errors if any entries in the table of expectations are less than 5. If this is the case, columns should be combined to eliminate these values.
| Ex | 0 | 1 | 2+ | 3+ |
|---|---|---|---|---|
| ≤ 2 | 12 | 17.3 | 8.3 | 2.3 |
| 3 | 12 | 17.3 | 8.3 | 2.3 |
| ≥ 4 | 12 | 17.3 | 8.3 | 2.3 |
Since there are expectations less than , we should combine the "" column with a neighbouring column. Try to combine with a column that has similar characteristics.
| Ex | 0 | 1 | 2+ |
|---|---|---|---|
| ≤ 2 | 12 | 17.3 | 10.6 |
| 3 | 12 | 17.3 | 10.6 |
| ≥ 4 | 12 | 17.3 | 10.6 |
Now we have all entries greater than or equal to 5.
Step 4: Perform the same column combination to the table of observations.
| Obs | 0 | 1 | 2+ |
|---|---|---|---|
| ≤ 2 | 12 | 18 | 10 |
| 3 | 22 | 18 | 0 |
| ≥ 4 | 2 | 16 | 22 |
Step 5: Using the formula:
For the contributions table:
| Cont | 0 | 1 | 2+ |
|---|---|---|---|
| ≤ 2 | 0 | 0.02567 | 0.04159 |
| 3 | 8.333 | 0.02567 | 10.667 |
| ≥ 4 | 8.333 | 0.10251 | 12.04384 |
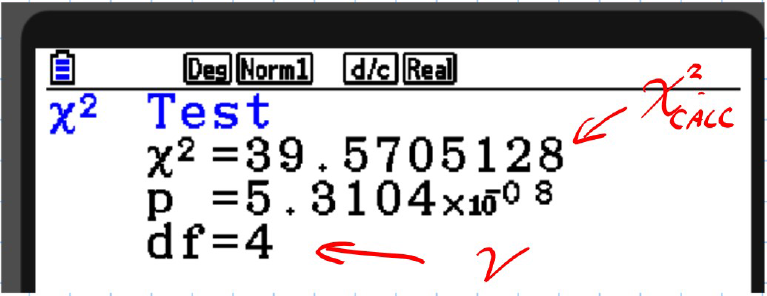
Step 6: The test statistic is the sum of all those contributions. It is called:
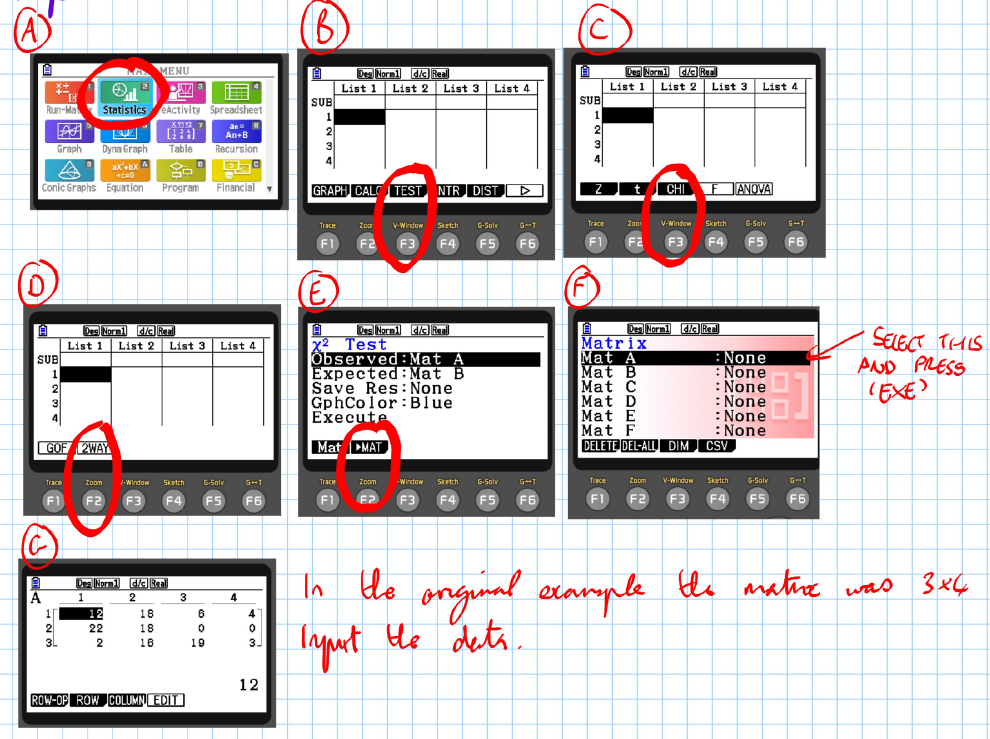
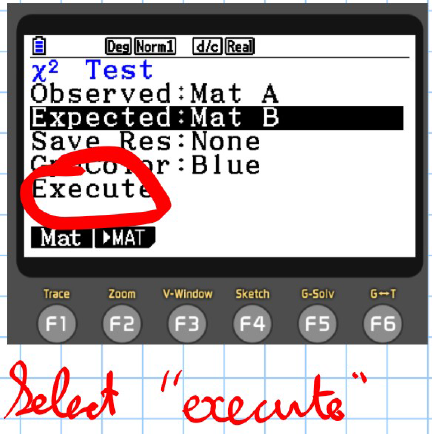
To get from the graphical calculator, follow these steps:
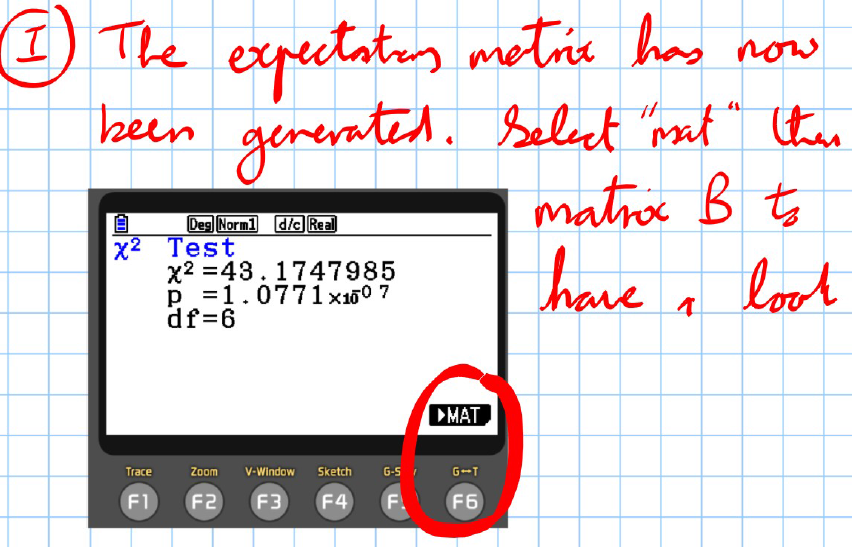
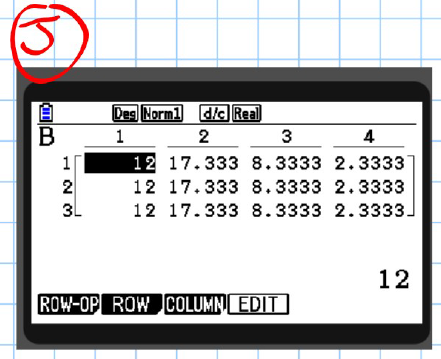
This shows us that we need to combine columns and . Do this, then re-input the combined observations matrix.
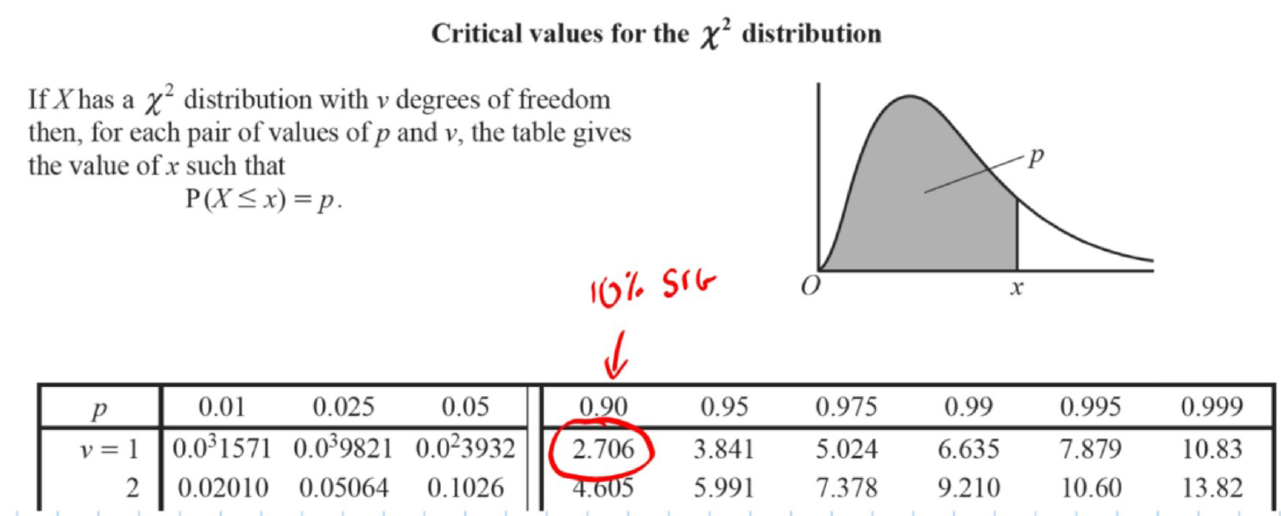
Step 7**: Calculate the number of "degrees of freedom"** and compare your to the in the table.
Degrees of freedom are variables whose values are left to advance. If we can deduce the value of a variable, then it is not "free."
The number of degrees of freedom, represented by the Greek letter ("nu"), is:
Here (as our combined observations matrix was ).
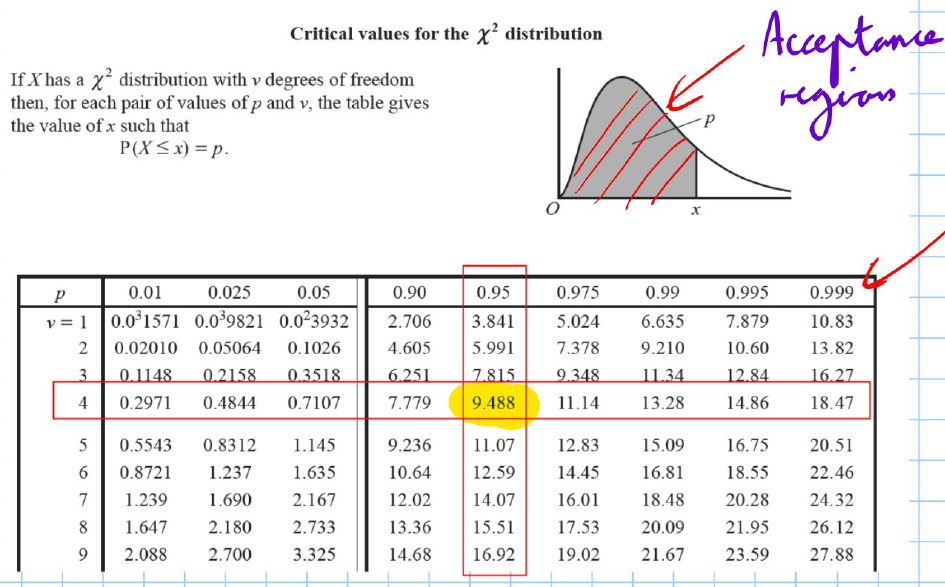
This is the acceptance level but sig level is the rejection level
Step 8: Conclude
Sufficient evidence to suggest that the number of bedrooms and number of children are not independent.
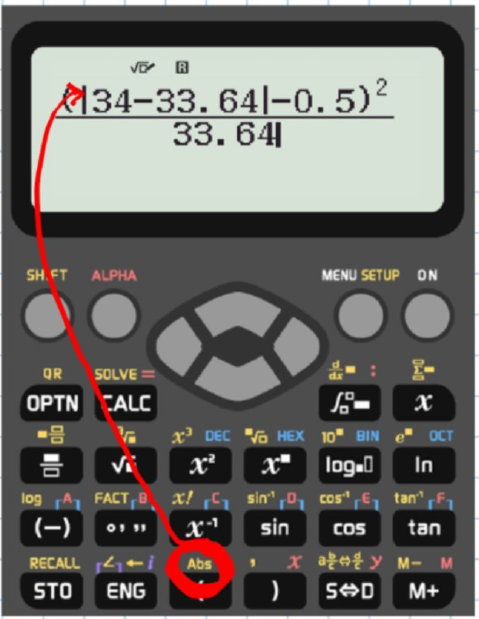
Yates' Correction
The test is known to provide unreliable results when r = 1. In order to correct for this error, we adjust the contribution formula as follows:
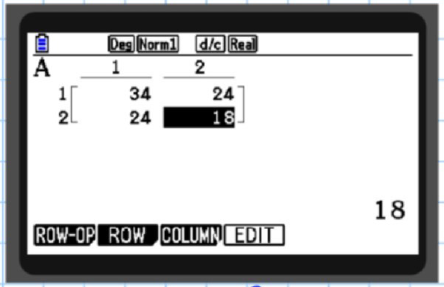
Example: The following contingency table shows the results of people in a driving test along with their gender:
| Result | Male | Female |
|---|---|---|
| Pass | 34 | 24 |
| Fail | 24 | 18 |
Test at the 10% significance level if the outcome of the test is independent of the gender.
- Null Hypothesis (): Result and gender are independent.
- Alternative Hypothesis (): Result and gender are not independent. Since , we must perform a Yates' correction.
Observed Table:
Expected Table:
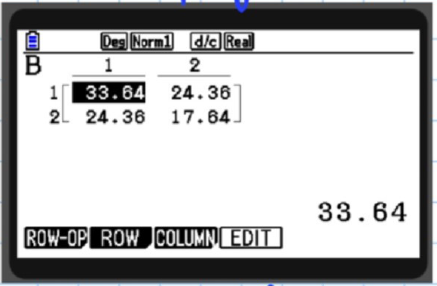
Note: Do not use the calculator's test statistic as Yates' correction is not performed by the calculator.
Contributions:
Conclusion:
- Do not reject
- Insufficient evidence to suggest that gender and results are dependent.