Size & Power of Test (Edexcel A-Level Further Mathematics): Revision Notes
21.3.2 Size & Power of Test
Confidence Intervals
A point estimate is an estimate of a feature of the population from a sample.
An x% confidence interval for the μ coincides with the acceptance region for a (100 - x)% significance level test for the sample mean.
It does not tell us that the mean lies within the interval with x% confidence. It tells us that if a large number of such intervals were calculated based on different point estimates of μ, we would expect x% of those to contain μ.
Example Take the data set
12, 16, 10, 9, 12
If we are given that these are from a normally distributed population, the is a point estimate for μ and for .
However, due to the nature of statistical error, the point estimate may not be completely accurate; however, we can give bounds within which we know the population parameter we are estimating is likely to lie. These are called confidence intervals.
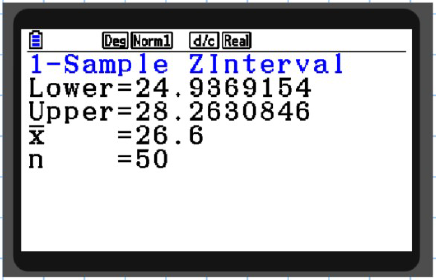
Example A point estimate from a sample of size 50 is calculated to be 26.6 for the mean μ. Given the population is known to have standard deviation σ = 6, construct a 95% confidence interval for μ.
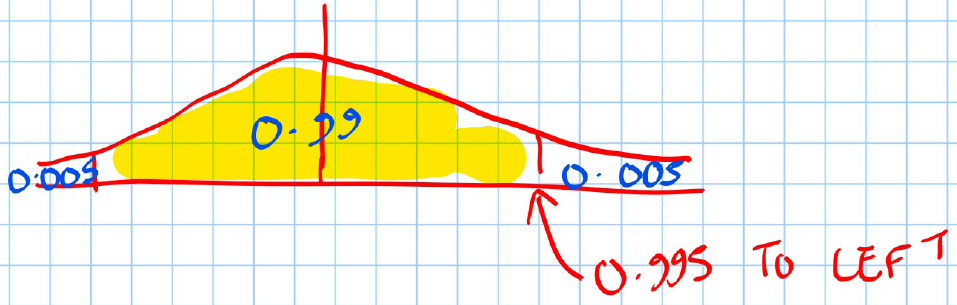
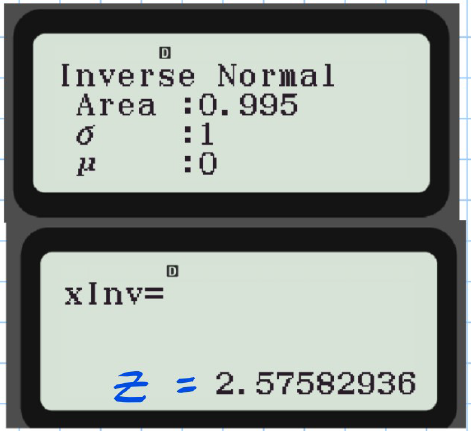
- Draw a diagram to aid in determining the correct z-value to calculate:
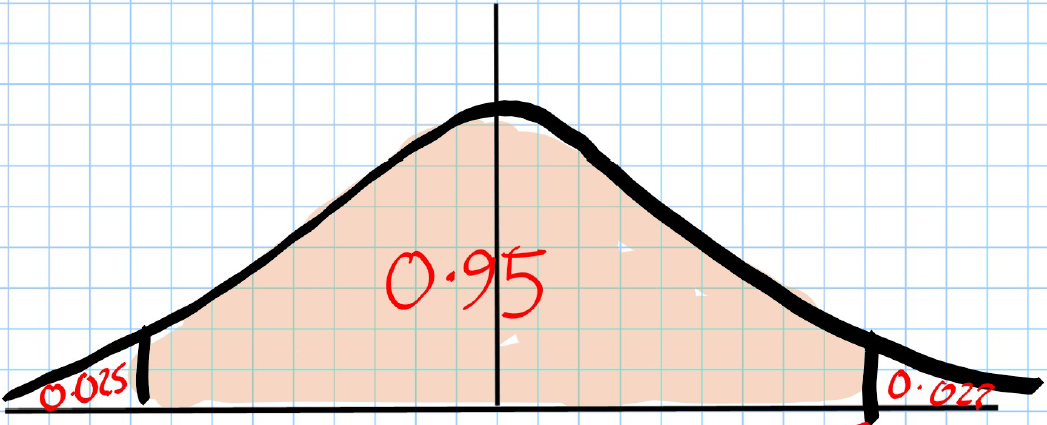
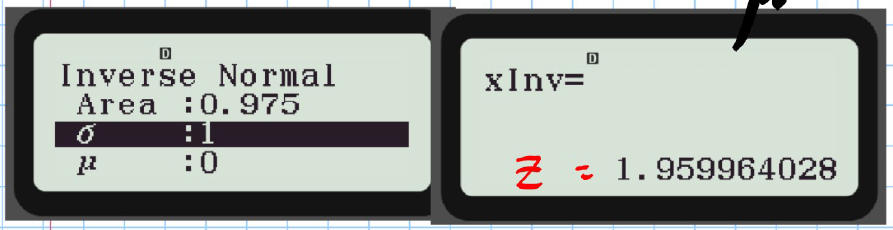
CALCULATE Z-Value associated with 0.975
- The mean μ lies within the confidence interval to the given degree of confidence according to the following formula:
Where:
- is the centre of the interval (sample mean).
- is how many standard deviations we want our boundary to lie from .
- is the standard deviation of the sampling distribution to reach our Z-value to fit our desired distribution.
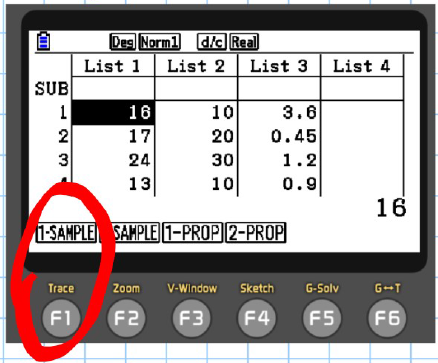
How to Calculate Confidence Intervals on a Graphical Calculator
-
A) Stats Mode

-
B) Interval Mode
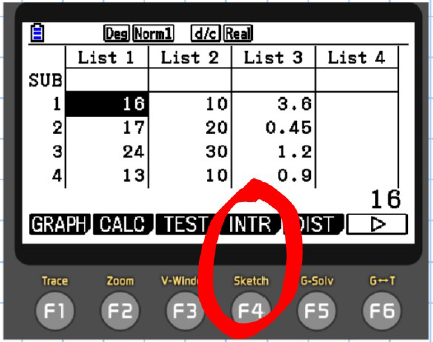
-
C) Z Interval
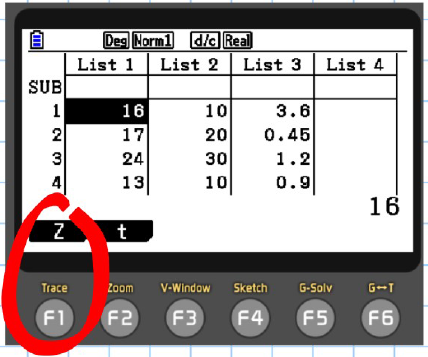
-
D) Select 1-Sample
-
E) Input data:
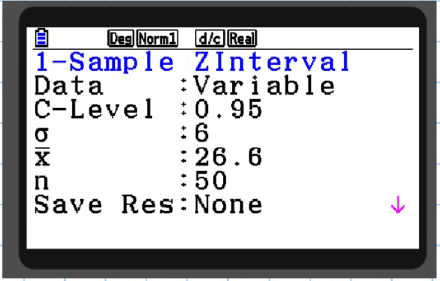
-
F) Output displays the lower and upper bounds.
Note: "List" mode can be used instead of variable if data is given.
Past Paper Example
Q2 (June 2008, Q1)
Some biologists were studying a large group of wading birds. A random sample of 36 were measured, and the wing length x mm of each wading bird was recorded. The results are summarised as follows:
Questions:
(a) Calculate unbiased estimates of the mean and the variance of the wing lengths of these birds.
Given that the standard deviation of the wing lengths of this particular type of bird is actually 5.11 mm.
(Normally we would use to estimate but to catch us out we have keen gives the population σ
(b) Find a 99% confidence interval for the mean wing length of the birds from this group.
Solution: (a)
Solution: (b)
99%: (from the z-table)
CI (Confidence Interval) Calculation:
CI =
Substituting values:
CI = (165.75, 170.13)
