Correlation & Regression (Edexcel A-Level Mathematics): Revision Notes
2.4.1 Correlation & Regression
Correlation
Linear correlation is a measure of how close a set of points lie to a straight line. Correlation is measured using a value called the Product Moment Correlation Coefficient, or , for short.
How to Calculate the Value
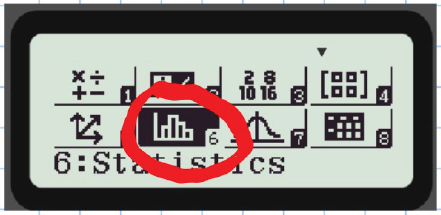
Step 1
- Select the "Lin" option.
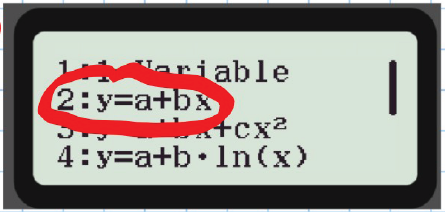
Step 2
- Choose .
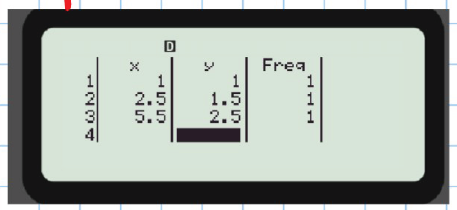
Step 3
- Input data.
Step 4
- Use the "OPTN" button.
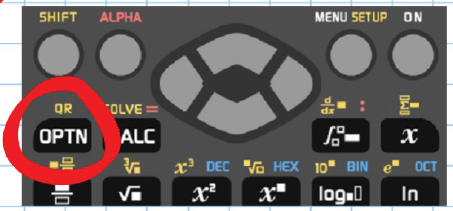
Step 5
- Select "Regression Calc".
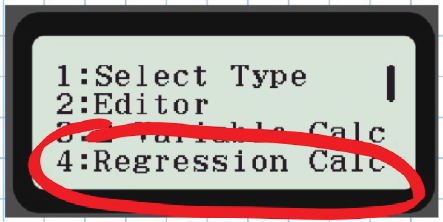
Step 6
- The value r will be displayed.
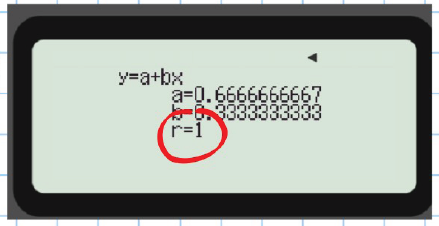
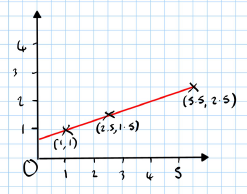
In this case, . This means perfect linear positive correlation between and .
Types of Correlation
There are different types of correlation that can be observed on the graph or through calculating the value.
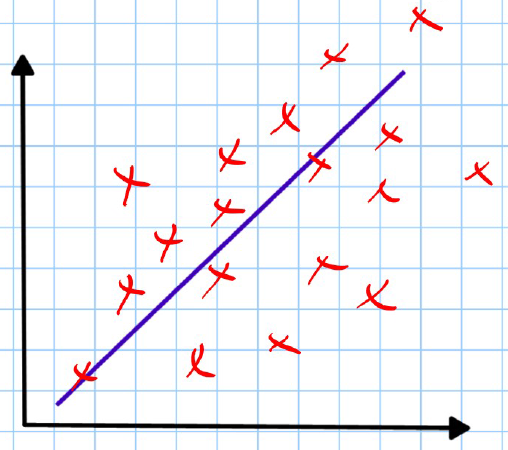
Strong Positive Correlation
- The points lie close to a straight line with a positive slope.
- will be close to .
Weak Positive Correlation
- The points show some positive correlation but are more spread out.
- .
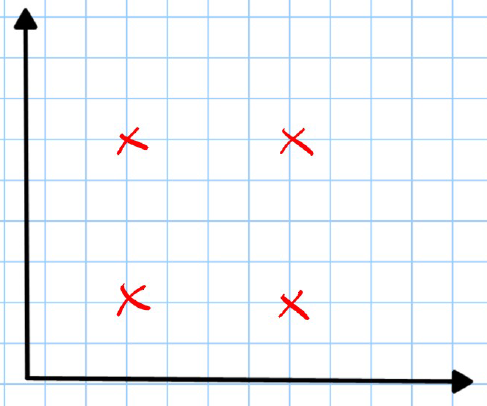
No Correlation
- The points do not show any trend or pattern.
- .
Weak Negative Correlation
- The points show some negative correlation but are more spread out.
- .
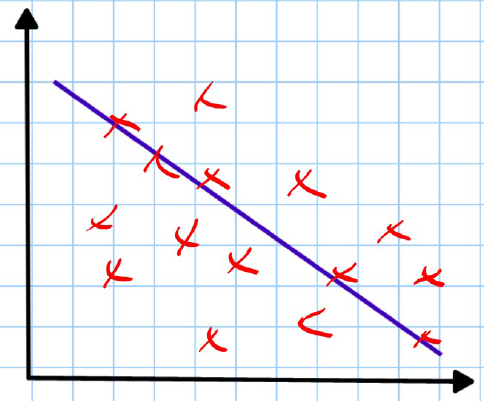
Strong Negative Correlation
- The points lie close to a straight line with a negative slope.
- is close to .
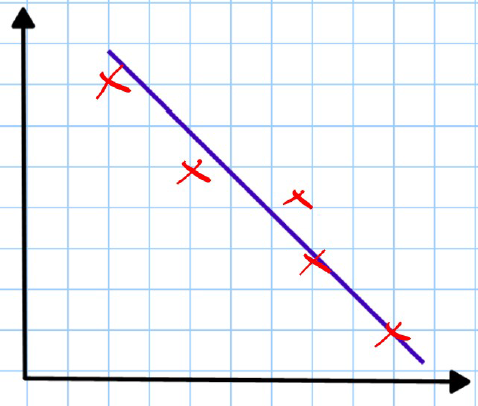
Perfect Negative Correlation
Example: Sea deaths vs Ice creams Perfect negative correlation so .
When describing correlation between two variables, it must be done in context (if possible).
If asked to describe the correlation between the variables in the above graph, we would write:
- "There is perfect negative correlation between the number of ice creams sold and sea deaths. As more ice creams are sold, the number of sea deaths decreases." Be careful not to state that one causes the other as:
"Correlation does not imply CAUSATION."
Regression Line
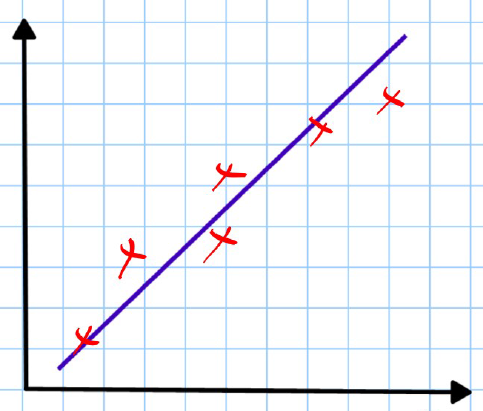
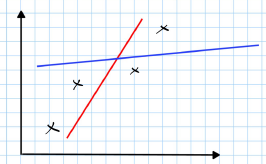
A regression line is the best line that passes through the mean point and minimises the distance between the line and the points.
- Red Line: The red line is a better line of best fit because each point lies closer to the red line than the blue.
To calculate the regression line, use the same method as used for calculating .
Example: Calculate the Regression Line
Important Point
It is only appropriate to use the regression line when:
- The relationship exhibited by the data appears linear.
- The value of r is sufficient to suggest strong enough correlation. We only use the equation to make predictions close to or within the range of data we have. This is because we cannot be sure that the relationship will remain linear beyond our data.
Example:
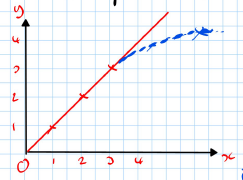
- Make a prediction for based on the data given:
- We predict when .
- However, after taking more data, we discover the relationship is actually the blue dotted line. We tried to extrapolate (make predictions beyond our data set), however, extrapolation is unreliable