Using Molecular Evidence in Classification (OCR A-Level Biology A): Revision Notes
Using Molecular Evidence in Classification
Development of molecular phylogeny
Until the mid-twentieth century, taxonomists classified organisms using data from anatomy, morphology, behaviour, physiology and cell structure. The development of new technologies enabled scientists to study macromolecules, particularly the sequences of amino acids in proteins and nucleotides in DNA. This led to the emergence of molecular phylogeny – a branch of biology that uses molecular data to determine evolutionary relationships between organisms.
Molecular evidence provides independent verification of classification systems based on structural features, and often reveals relationships that are not apparent from morphology alone. For example, molecular data shows that fungi are more closely related to animals than to plants, which is not obvious from their structure or growth patterns.
Using antibodies to compare species
Early molecular phylogeny research (beginning in 1904) used antibodies to detect similarities between proteins in different species. This method exploits the specificity of antibody-antigen binding.
Methodology
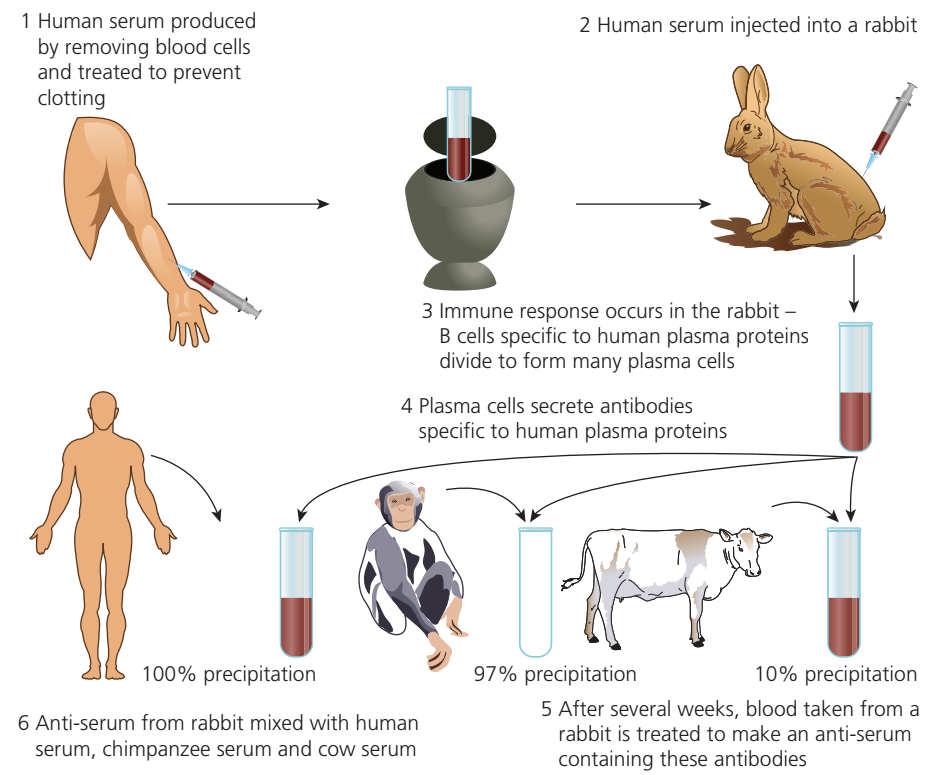
The technique involves several steps:
- Blood is taken from a species (e.g., humans) and processed to obtain serum by removing cells and preventing clotting
- This serum is injected into a test animal such as a rabbit or mouse
- After approximately one week, the test animal produces an immune response – B cells specific to the foreign proteins divide to form plasma cells
- These plasma cells secrete antibodies against the injected proteins
- Blood is taken from the test animal and processed to create an anti-serum containing these antibodies
- The anti-serum is then mixed with serum from various species
Interpretation of results
When the anti-serum is mixed with serum from different species, the degree of precipitation indicates the similarity between proteins:
- Higher precipitation = greater similarity between proteins
- Lower precipitation = fewer shared proteins or more divergent protein structures
Worked Example: Interpreting Antibody Precipitation Results
When rabbit anti-serum produced against human plasma proteins was tested:
- Human serum: precipitation
- Chimpanzee serum: precipitation
- Cow serum: precipitation
This indicates that chimpanzees and humans share approximately of their plasma proteins, while humans and cattle share only about . These results reflect evolutionary relationships – humans and chimpanzees diverged from a common ancestor more recently than either diverged from cattle.
Protein sequencing
An alternative approach involves directly comparing the amino acid sequences of specific proteins. Cytochrome c has been particularly useful for this purpose because it:
- Occurs in many organisms where it plays a key role in respiration
- Is located in the inner membranes of mitochondria in eukaryotes
- Consists of a single polypeptide of approximately amino acids
- Has a conserved structure across diverse species
Reading amino acid sequences
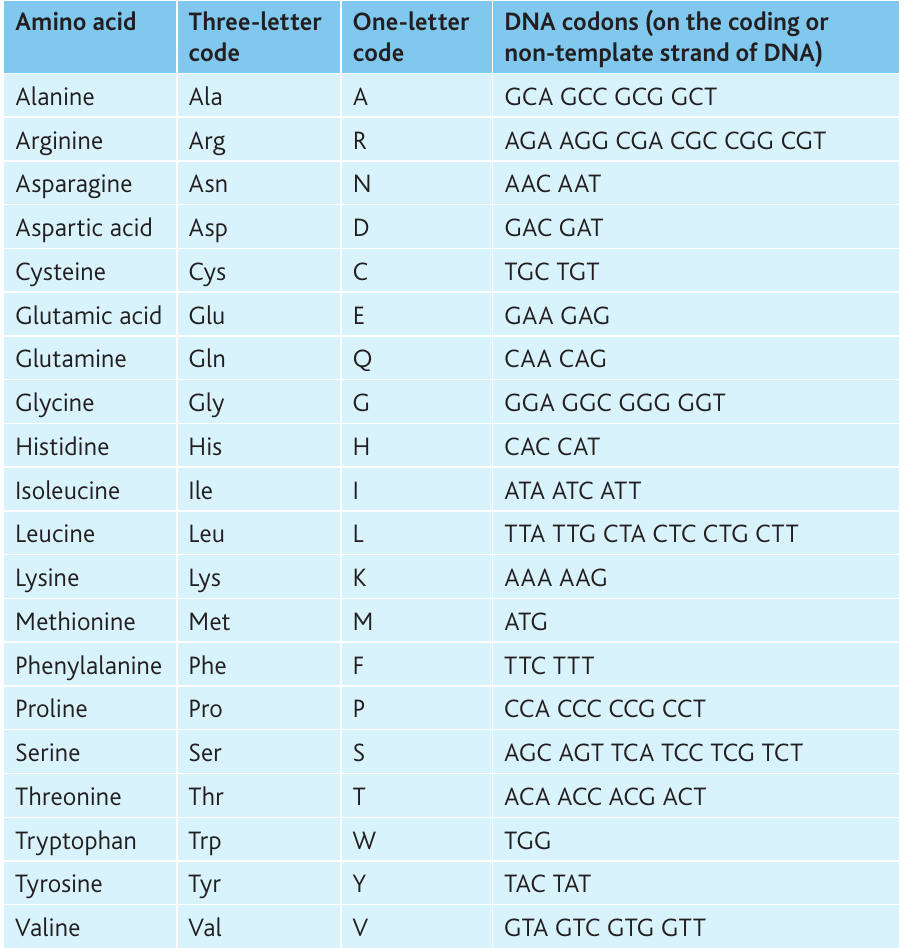
To interpret protein sequences, you need to understand both the three-letter and one-letter codes for amino acids. These codes are standardized across biology. The table below also shows the DNA codons (on the coding strand) that specify each amino acid.
Constructing phylogenetic trees from protein data
Researchers align amino acid sequences from multiple species and compare them position by position, identifying similarities and differences. The number of differences indicates evolutionary distance – species with fewer differences shared a more recent common ancestor.
The branch lengths in phylogenetic trees are drawn proportional to the number of sequence differences. This produces a visual representation of evolutionary relationships.
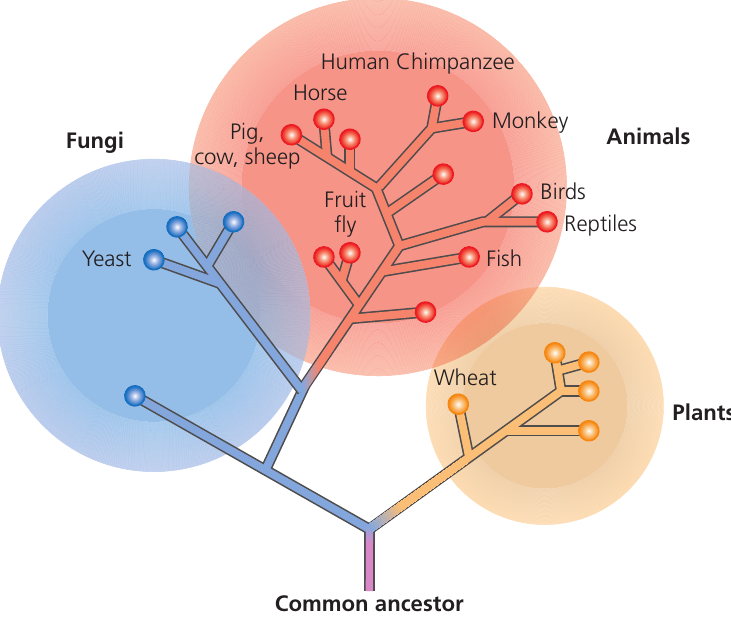
This phylogenetic tree based on cytochrome c sequences clearly reveals the three main kingdoms of eukaryotes: fungi, animals and plants. Such molecular trees generally agree closely with classification systems based on morphology and anatomy, providing independent evidence for common descent and evolutionary relationships.
DNA hybridisation
DNA molecules consist of two complementary strands held together by hydrogen bonds between base pairs. DNA hybridisation exploits this structure to compare genetic similarity between species.
Principle
- Heating DNA to approximately breaks the hydrogen bonds between bases, separating the two strands
- When single-stranded DNA from two different species is mixed and allowed to cool, the strands attempt to bond together
- However, genetic differences between species mean the match is imperfect
- More imperfect matches have weaker hydrogen bonding and require less heat to separate the strands
- Closer matches require more heat to break the bonds
Applications
DNA hybridisation provided early evidence that chimpanzees and humans are more genetically similar to each other than either is to gorillas or orangutans. This molecular evidence supported earlier antibody-based research showing similar patterns.
DNA sequencing
DNA sequencing has become the most powerful method for determining evolutionary relationships. It provides more detailed and comprehensive data than either antibody comparisons or protein sequencing.
Advantages over protein sequencing
DNA sequencing offers several key advantages:
More detailed information: Two species may have identical amino acid sequences in a protein, but different DNA sequences coding for that protein. This is because the genetic code is degenerate – most amino acids are specified by two or more different codons. For example, leucine has six different codons (TTA, TTG, CTA, CTC, CTG, CTT). Comparing DNA sequences reveals these hidden differences.
Detection of mutations: DNA sequencing can identify:
- Silent mutations: changes to base pairs that produce the same amino acid due to code degeneracy
- Neutral mutations: changes that alter the amino acid but not the functional properties (e.g., substituting one non-polar amino acid for another)
- Functional changes that have become fixed in populations
Greater accessibility: Modern sequencing technology makes it easier to sequence DNA than proteins, and databases contain extensive sequence information for comparison.
Stability: DNA is more stable than protein, allowing sequencing of genetic material from extinct organisms such as:
- Mammoths (extinct approximately years ago)
- Neanderthals (remains dated to years ago)
Choice of genes for sequencing
Different genes evolve at different rates, making them suitable for answering different evolutionary questions:
Slowly changing genes (e.g., ribosomal RNA genes):
- Useful for determining relationships between higher taxonomic groups (domains, kingdoms, phyla)
- rRNA genes are particularly valuable because they change slowly and are found across all life forms
Rapidly changing genes:
- Help identify relationships between closely related species
- Useful for studying recent speciation events
- Can distinguish between isolated populations of the same species
Mitochondrial DNA:
- Does not contain non-coding sequences within genes, making alignment easier
- Not combined with histone proteins ('naked' DNA)
- Present in multiple copies per cell
- Has a higher mutation rate, useful for studying closely related organisms
- Inherited maternally with relatively little change
- Extensively sequenced for many species
Housekeeping genes:
- Code for proteins required for fundamental cellular processes common to all organisms
- Provide useful comparative data across diverse species
Non-coding DNA sequences
In eukaryotes, much nuclear DNA does not code for proteins. These non-coding sequences have various functions or may have no known function. They are relatively free to accumulate mutations without affecting protein structure, and therefore provide valuable information about evolutionary relationships and genetic drift.
Case study: marsupials and placentals
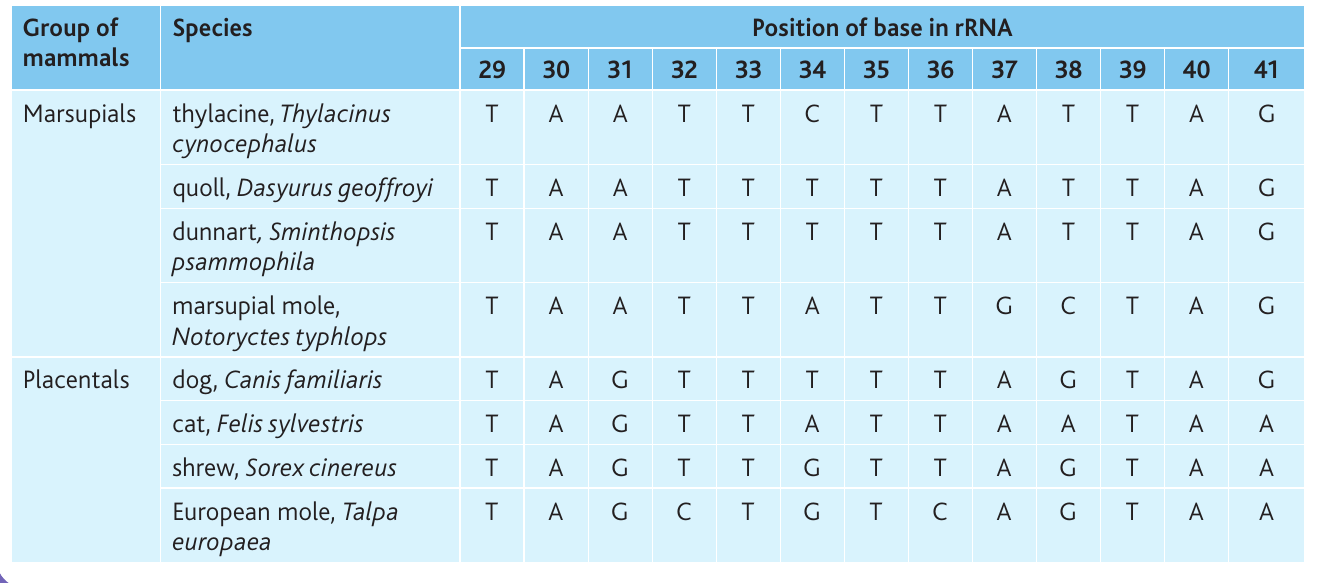
Researchers compared rRNA gene sequences from mitochondria in eight mammalian species – four marsupials (including the extinct thylacine) and four placentals. The table shows nucleotide positions 29-41 in aligned sequences:
Worked Example: Interpreting Sequence Alignment Data
Key observations from this data:
- All eight species share approximately of nucleotides at these positions – far higher than would occur by chance, indicating common ancestry
- Some positions are identical across all species (e.g., positions 29, 30, 33, 35, 36, 39, 40, 41 are highly conserved)
- Position 31 shows clear separation: marsupials have A, placentals have G
- Position 38 shows variation among marsupials (T or C) but is consistently G in placentals
- Position 32 varies among placentals but is consistently T in marsupials
These patterns help identify which species are more closely related and support the separation of marsupials and placentals into distinct groups.
Gene barcoding
DNA sequencing enables species identification through gene barcoding – using specific gene sequences as unique identifiers for species. Researchers:
- Sequence particular genes from identified specimens
- Publish these sequences as 'barcodes'
- Deposit barcodes in databases for public access
- Use barcodes to identify unknown specimens
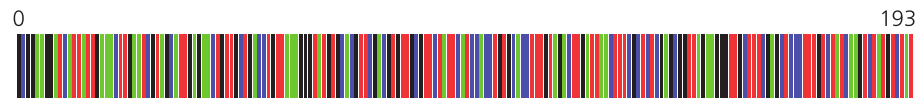
This barcode shows the first bases in the gene for mitochondrial cytochrome oxidase from the fungus Armillaria gallica. Each nucleotide (A, T, C, G) is represented by a different colour. Barcoding has revealed that fruiting bodies of this species found many miles apart can belong to the same underground mycelium network.
Databases for molecular phylogeny
Molecular sequence data is stored in publicly accessible online databases, enabling researchers worldwide to share and compare information:
The Tree of Life (http://tolweb.org)
- Provides information on biodiversity, characteristics of organism groups and evolutionary history
NCBI Taxonomy Database (www.ncbi.nlm.nih.gov/taxonomy)
- Contains information on approximately of described species
- Linked to DNA and protein sequence databases
- Part of the National Center for Biotechnology Information
Animal Diversity Web (http://animaldiversity.ummz.umich.edu)
- Curated by University of Michigan
- Contains data on animal natural history, distribution, classification and conservation
The National Herbarium of The Netherlands (http://vstbol.leidenuniv.nl)
- Largest single plant database
- Records of over million specimens
Encyclopedia of Life (EoL) (http://eol.org)
- Aims to provide a web page for every species
- Aggregates information from museums, scientific societies and experts
- Single, easy-to-use online portal
These databases allow researchers to:
- Compare new sequences with existing data
- Identify species from molecular evidence
- Study evolutionary relationships across the tree of life
- Access information without geographical or institutional barriers
Classification systems and molecular evidence
Molecular evidence has transformed how biologists classify organisms:
Confirms traditional classifications: Molecular phylogenetic trees often agree with classification systems based on morphology and anatomy, providing independent verification of evolutionary relationships.
Reveals hidden relationships: Molecular data can show connections not apparent from structure alone, such as the closer relationship between fungi and animals than between fungi and plants.
Enables comparison of similar species: DNA sequencing can distinguish between closely related species that lack obvious structural differences.
Dynamic and evolving: Classification systems are continuously updated as new molecular evidence emerges. Both the discovery of new species and reinterpretation of relationships between known species mean that taxonomic groupings and names change over time.
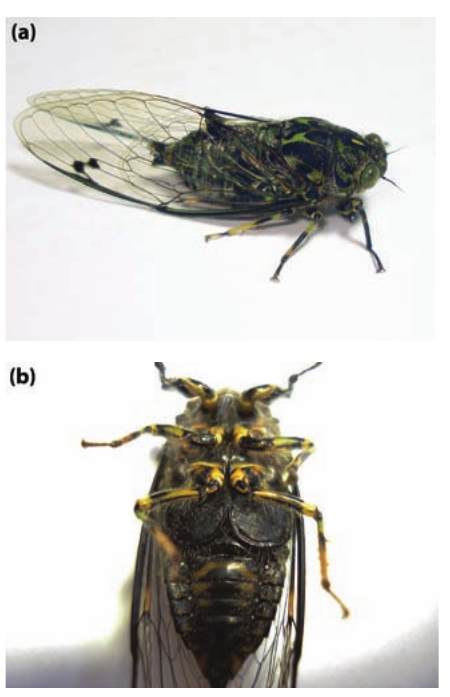
Case study: Australasian cicadas
Researchers investigated whether cicadas migrated to New Zealand from Australia by sequencing mitochondrial DNA from species across Australia, New Zealand and New Caledonia.
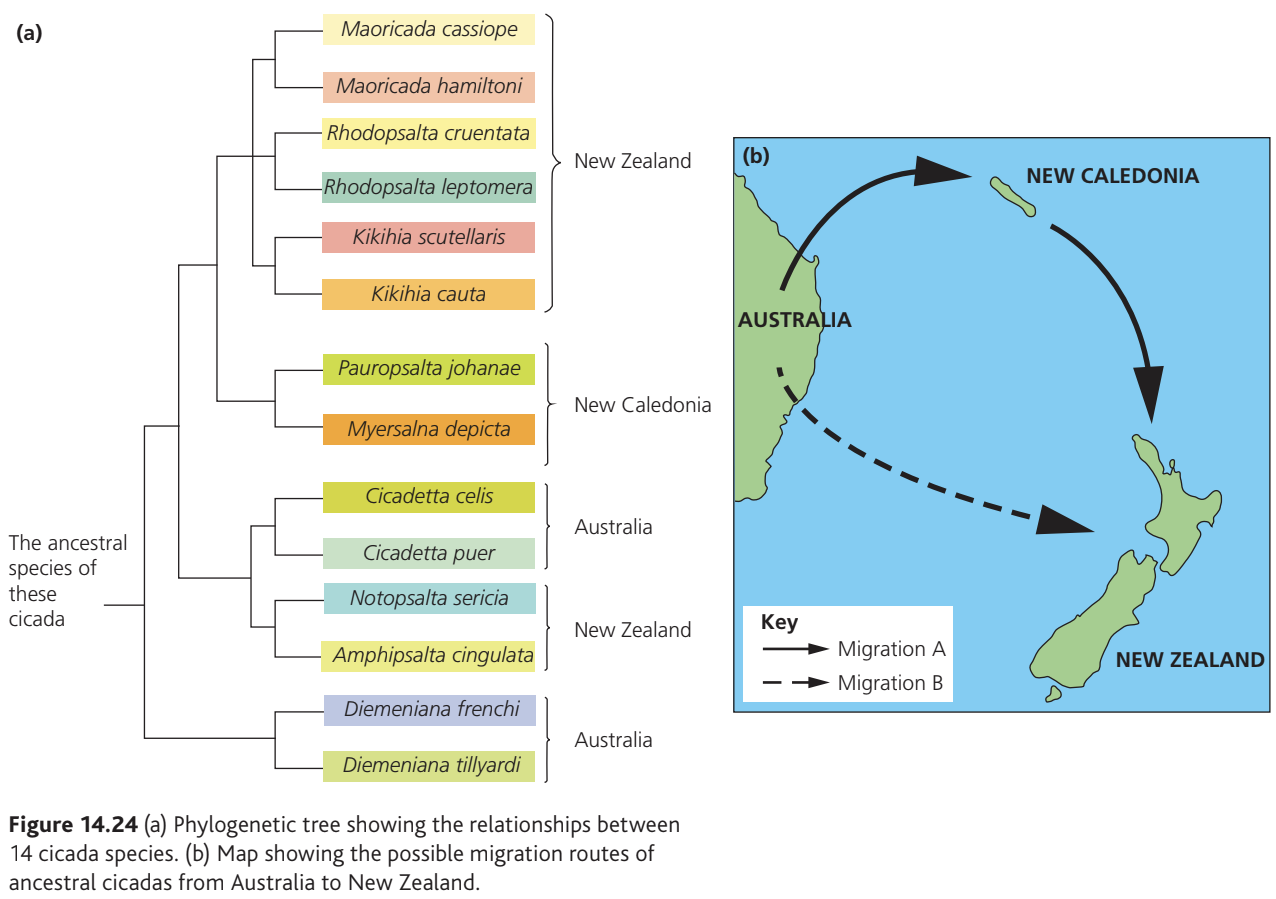
Worked Example: Interpreting a Phylogenetic Tree
The phylogenetic tree shows that:
- Eight cicada species in New Zealand form two distinct groups
- One group (species 1-6) is closely related to species from New Caledonia (species 7-8), suggesting possible migration via New Caledonia
- Another group (species 11-12) is more closely related to Australian species, suggesting direct migration from Australia
- Species 13-14 (Australian species) are most distantly related to all others
This molecular evidence supports the hypothesis that New Zealand cicadas originated from two separate migration events from Australia, occurring within the last million years.
Remember!
Key Points to Remember:
-
Molecular phylogeny uses DNA and protein sequences to determine evolutionary relationships, providing independent evidence that complements traditional classification based on morphology
-
Antibody-based methods provided early molecular evidence by measuring protein similarity through precipitation reactions; greater precipitation indicates closer evolutionary relationships
-
DNA sequencing advantages: reveals silent and neutral mutations hidden in protein sequences, provides more detailed data due to the degenerate genetic code, and enables analysis of extinct organisms
-
Gene choice matters: slowly evolving genes (like rRNA) are useful for comparing distantly related groups, while rapidly evolving genes help distinguish closely related species; mitochondrial DNA is particularly useful due to its structure and inheritance pattern
-
Classification is dynamic: molecular evidence continuously refines our understanding of evolutionary relationships, meaning taxonomic groupings and species names change as new data emerges